Understand where energy is being used
Use Consumption charts to see how energy is distributed across your installation.
Knowing how much energy your installation consumes is only the first step. Understanding where that energy is being used helps you focus on the areas that matter most.
Scout uses your asset hierarchy to break down consumption and show how each part of your installation contributes to the total.
See how consumption is distributed
The Consumption chart shows the total consumption of an asset together with the contribution of its child assets.
This makes it easy to compare different buildings, areas or other parts of your installation and see where energy is being used.
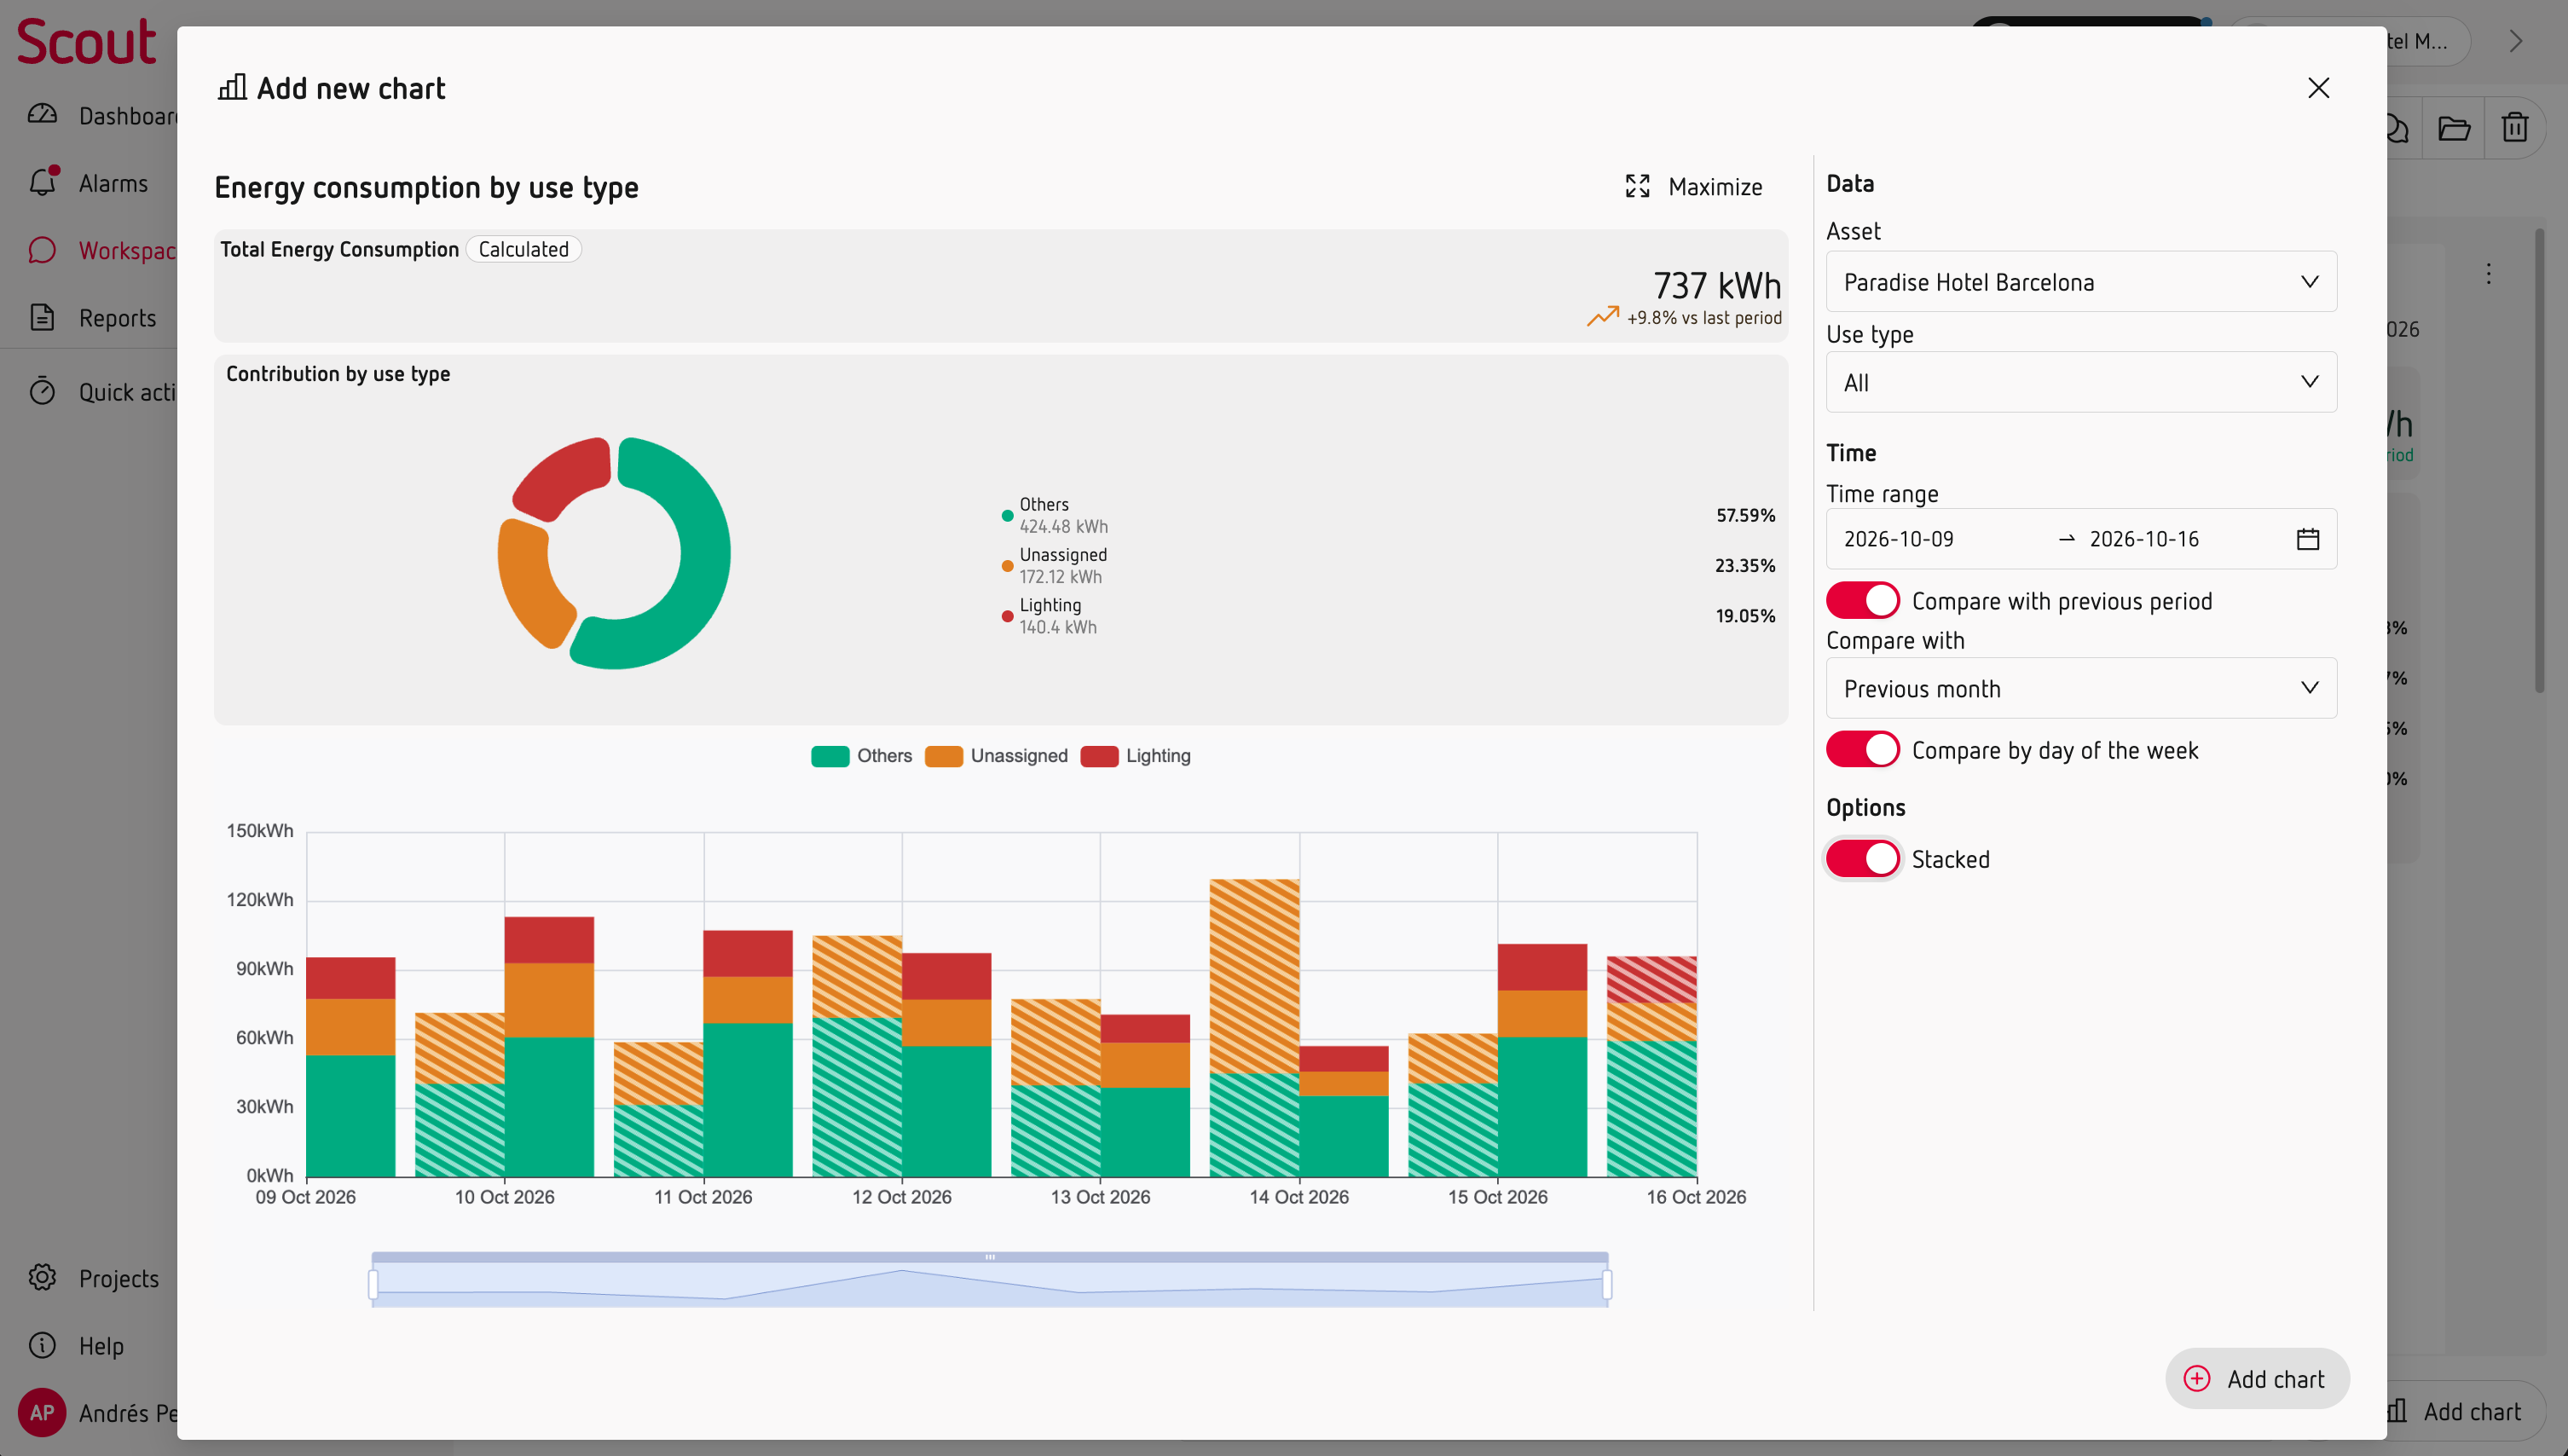
The chart can show the contribution of each child both as an absolute value and as a percentage of the total.
How does Scout calculate consumption?
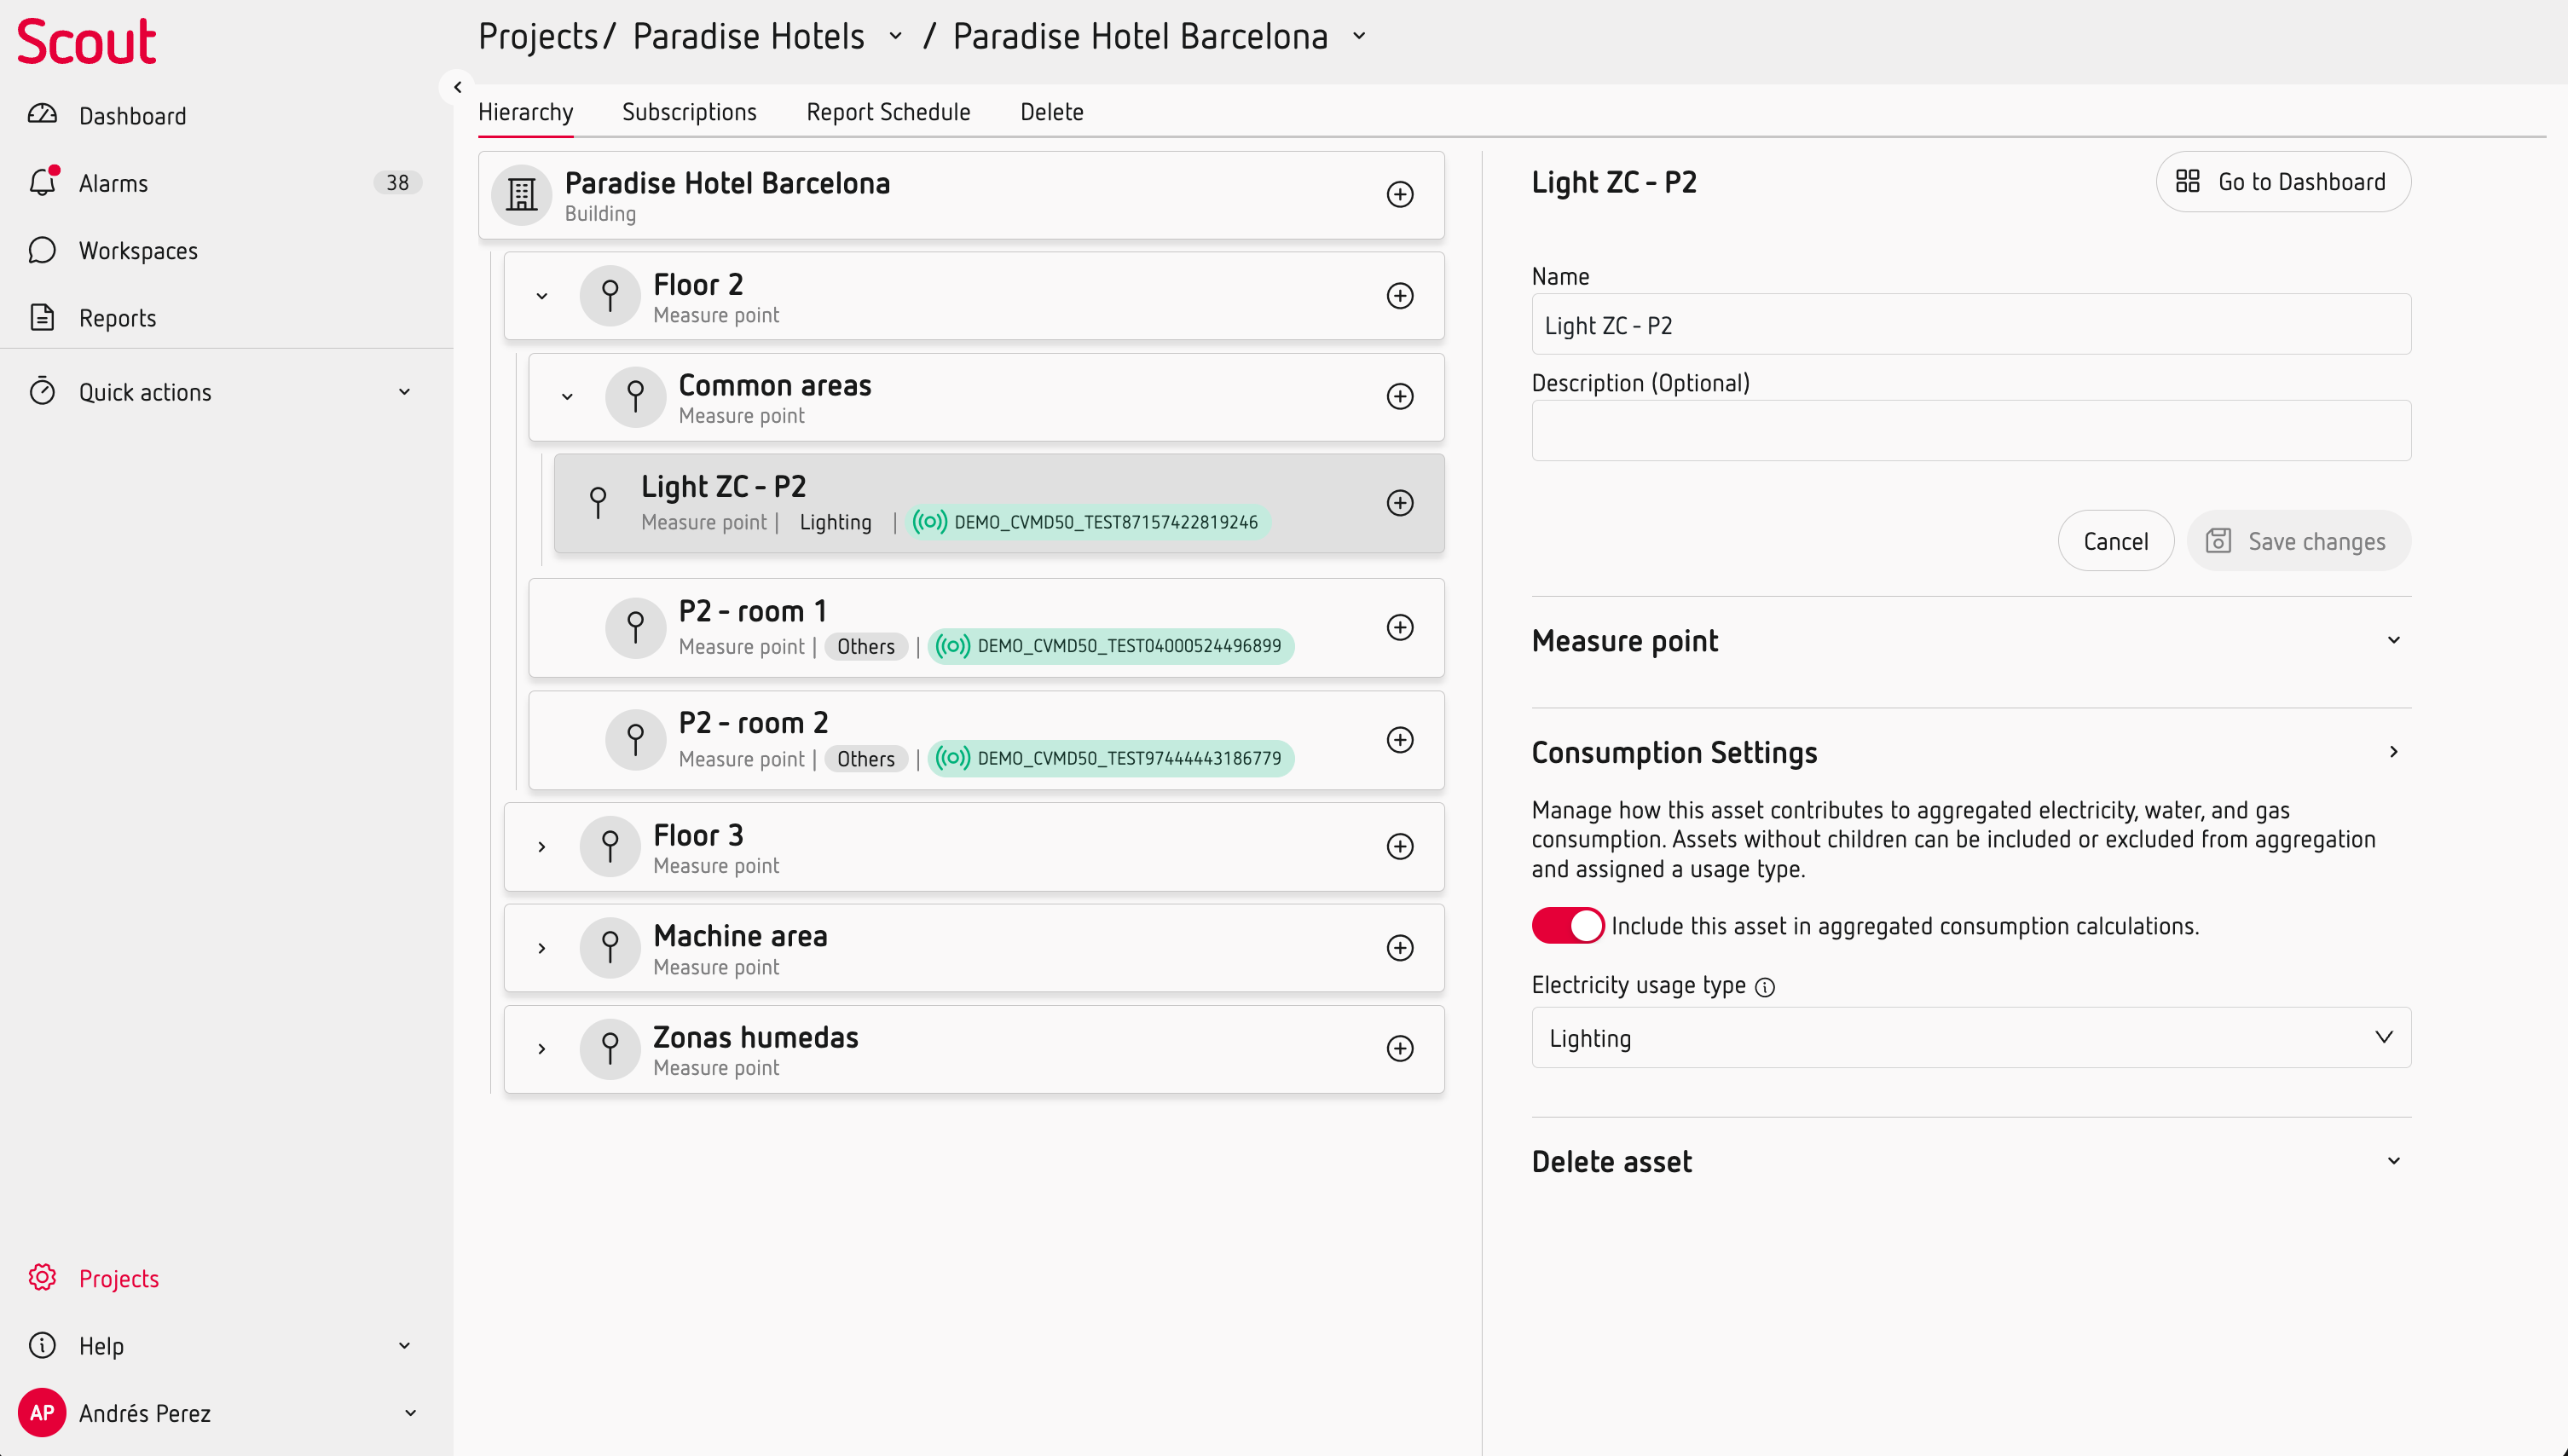
Scout calculates an asset's consumption from the consumption of its child assets when they have consumption measurements.
For example:
Building → Floor → Area → Equipment
The consumption of the Building can be calculated from the consumption of its child assets.
If a child asset should not be included in the calculation, you can exclude it from Project configuration.
Use the breakdown to find where to focus
The consumption breakdown can help you:
- Identify the areas with the highest consumption.
- Compare different parts of your installation.
- Understand how consumption is distributed across your asset hierarchy.
- Focus your analysis on the areas with the greatest impact.
For a more detailed analysis, you can explore the selected assets in a Workspace and investigate a specific period.