Analyse harmonics
Use the Harmonics Chart to understand harmonic distortion in voltage and current.
Harmonics can affect the performance of an electrical installation. Scout helps you quickly see whether harmonic distortion is present and investigate which harmonics are contributing to it.
See harmonic distortion at a glance
The Harmonics Chart shows the THD of voltage and current, helping you identify periods where harmonic distortion may be significant.
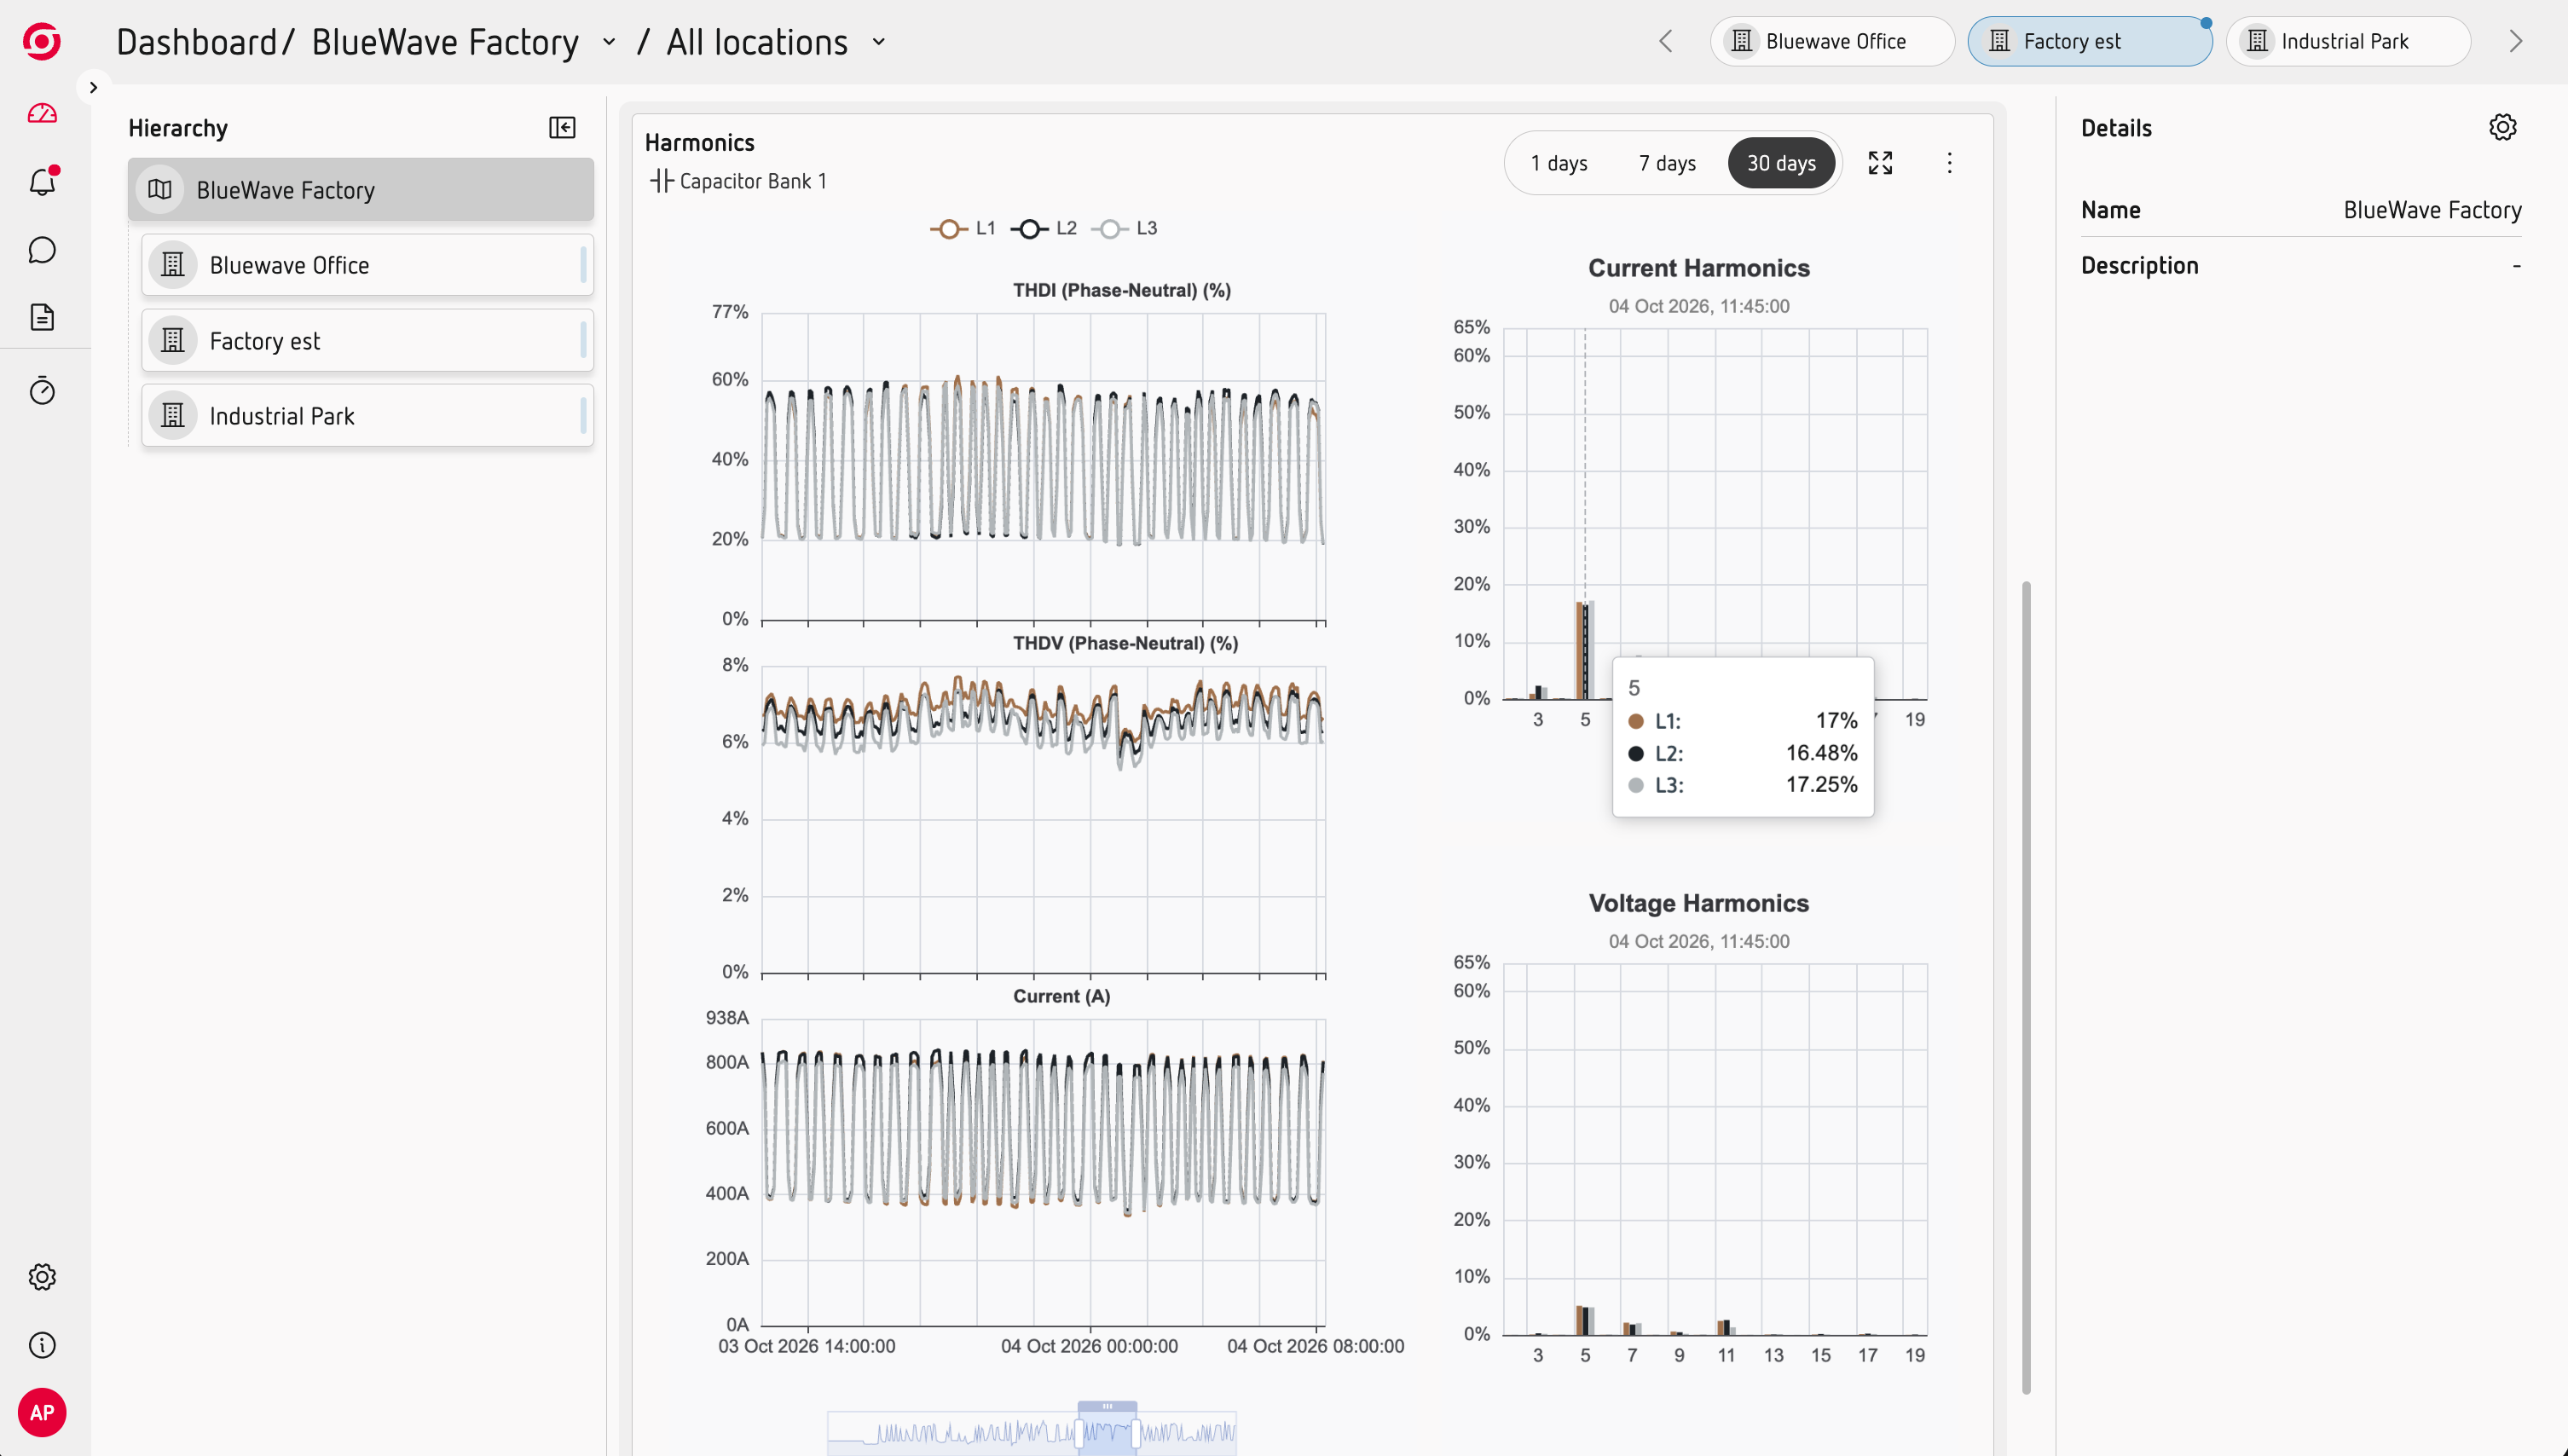
Use the chart to:
- Monitor voltage and current THD.
- Identify periods with higher harmonic distortion.
- Compare harmonic behaviour over time.
- Focus your analysis on periods that need further investigation.
Understand which harmonics are contributing
Click on the chart to see the harmonic breakdown for the selected point.
This shows the individual harmonic components and helps you identify which harmonic orders are most relevant.
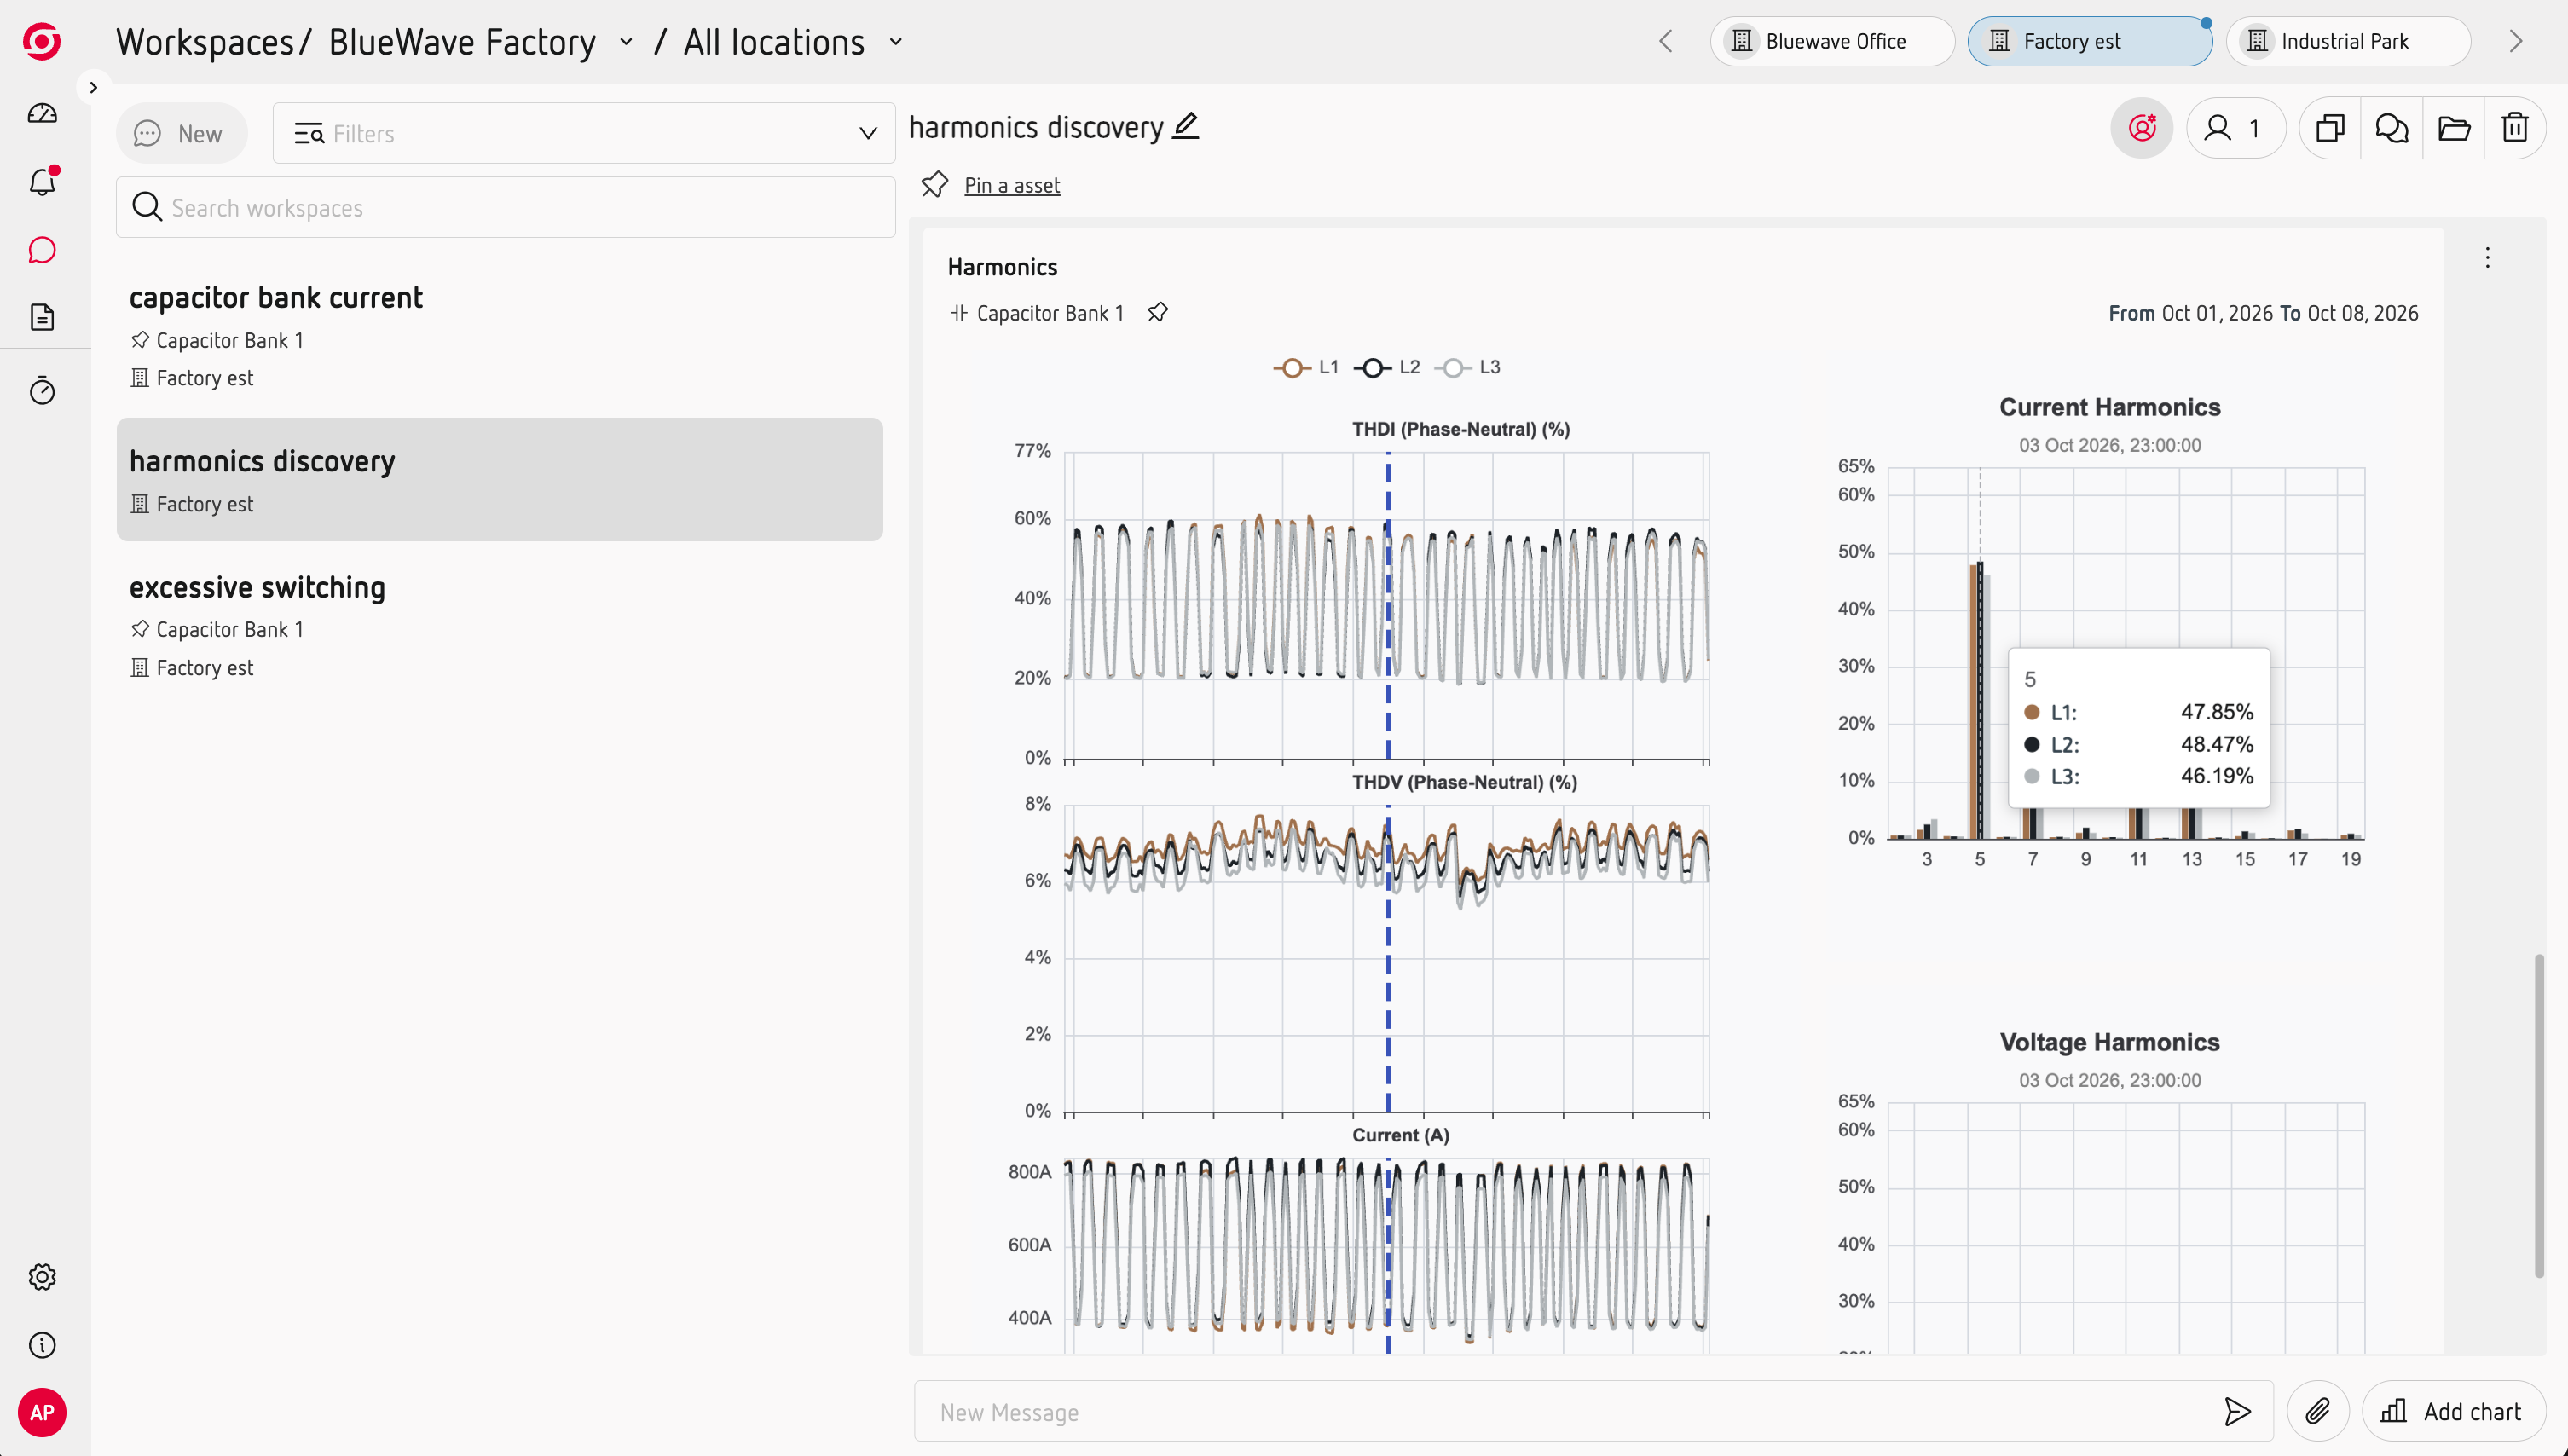
This can help you investigate where harmonic distortion may be coming from and understand which part of the installation may require attention.
Investigate a harmonic problem
When you identify an abnormal harmonic level, you can use a Workspace to analyse the period in more detail.
Combine the Harmonics Chart with other measurements, events or waveforms to investigate what was happening in your installation.
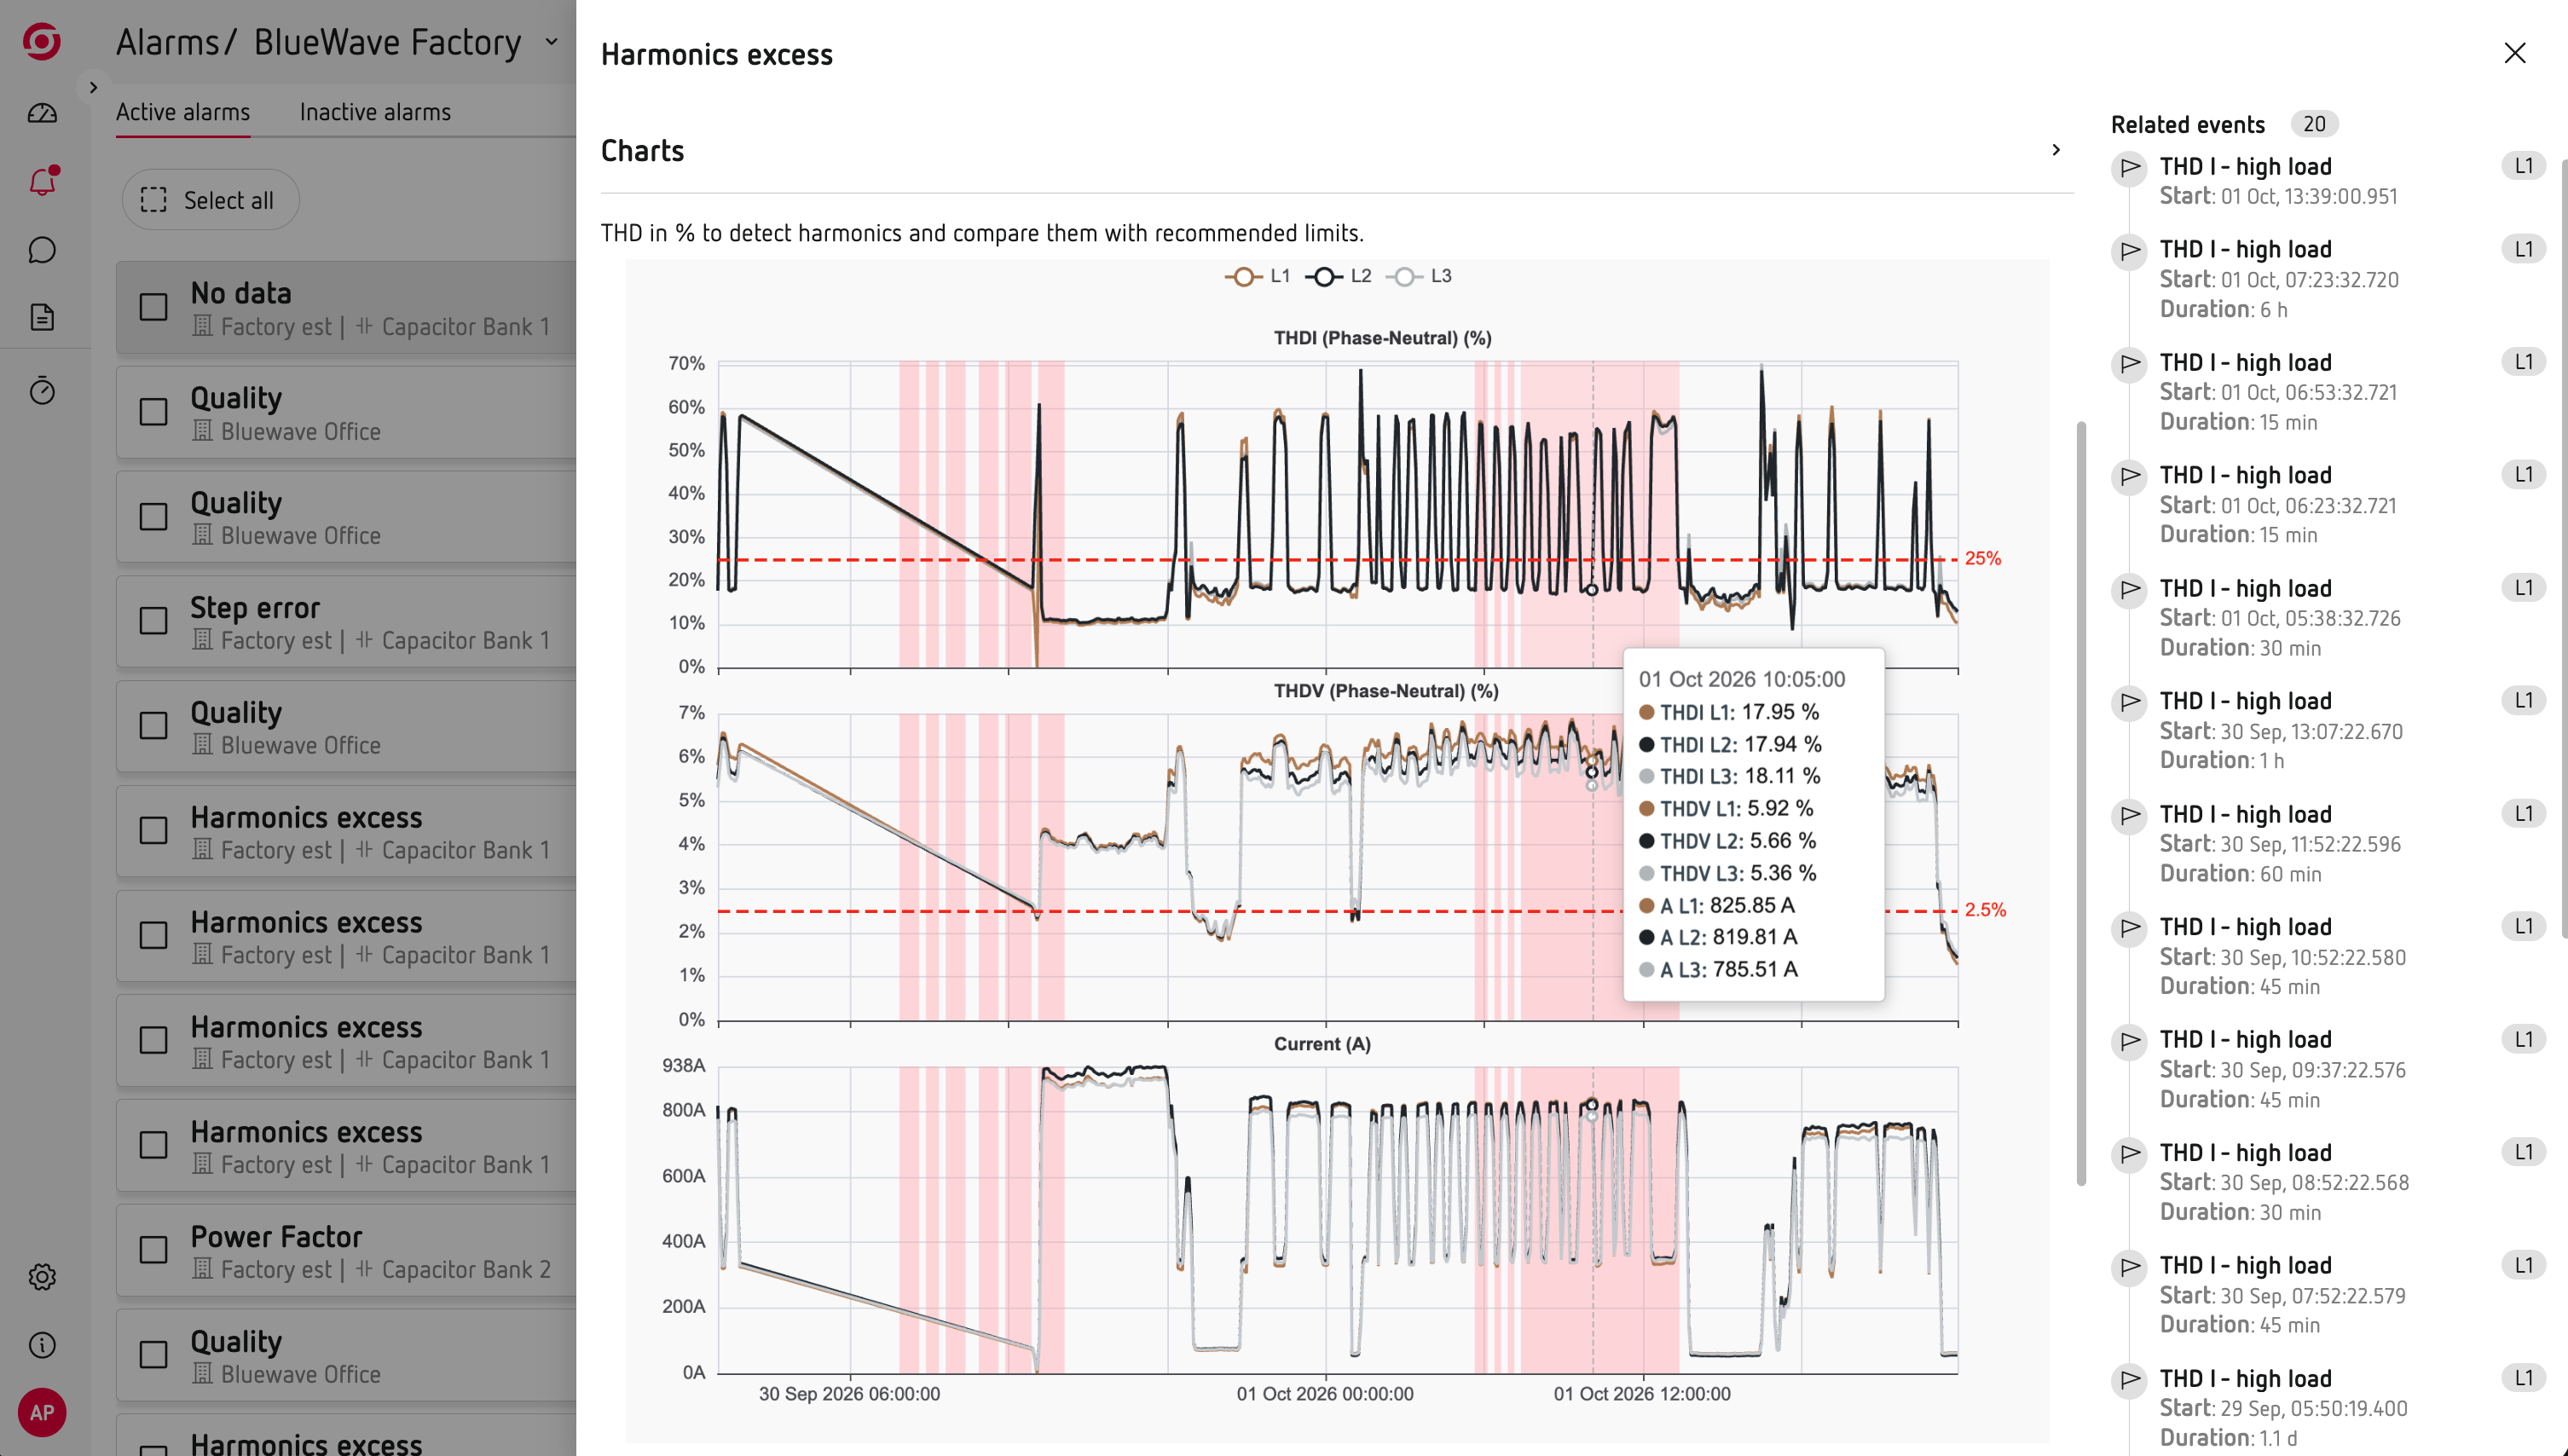
Scout can also generate a harmonic alert when voltage or current harmonics exceed the relevant thresholds. For current harmonics, the alert also takes the installation load into account.