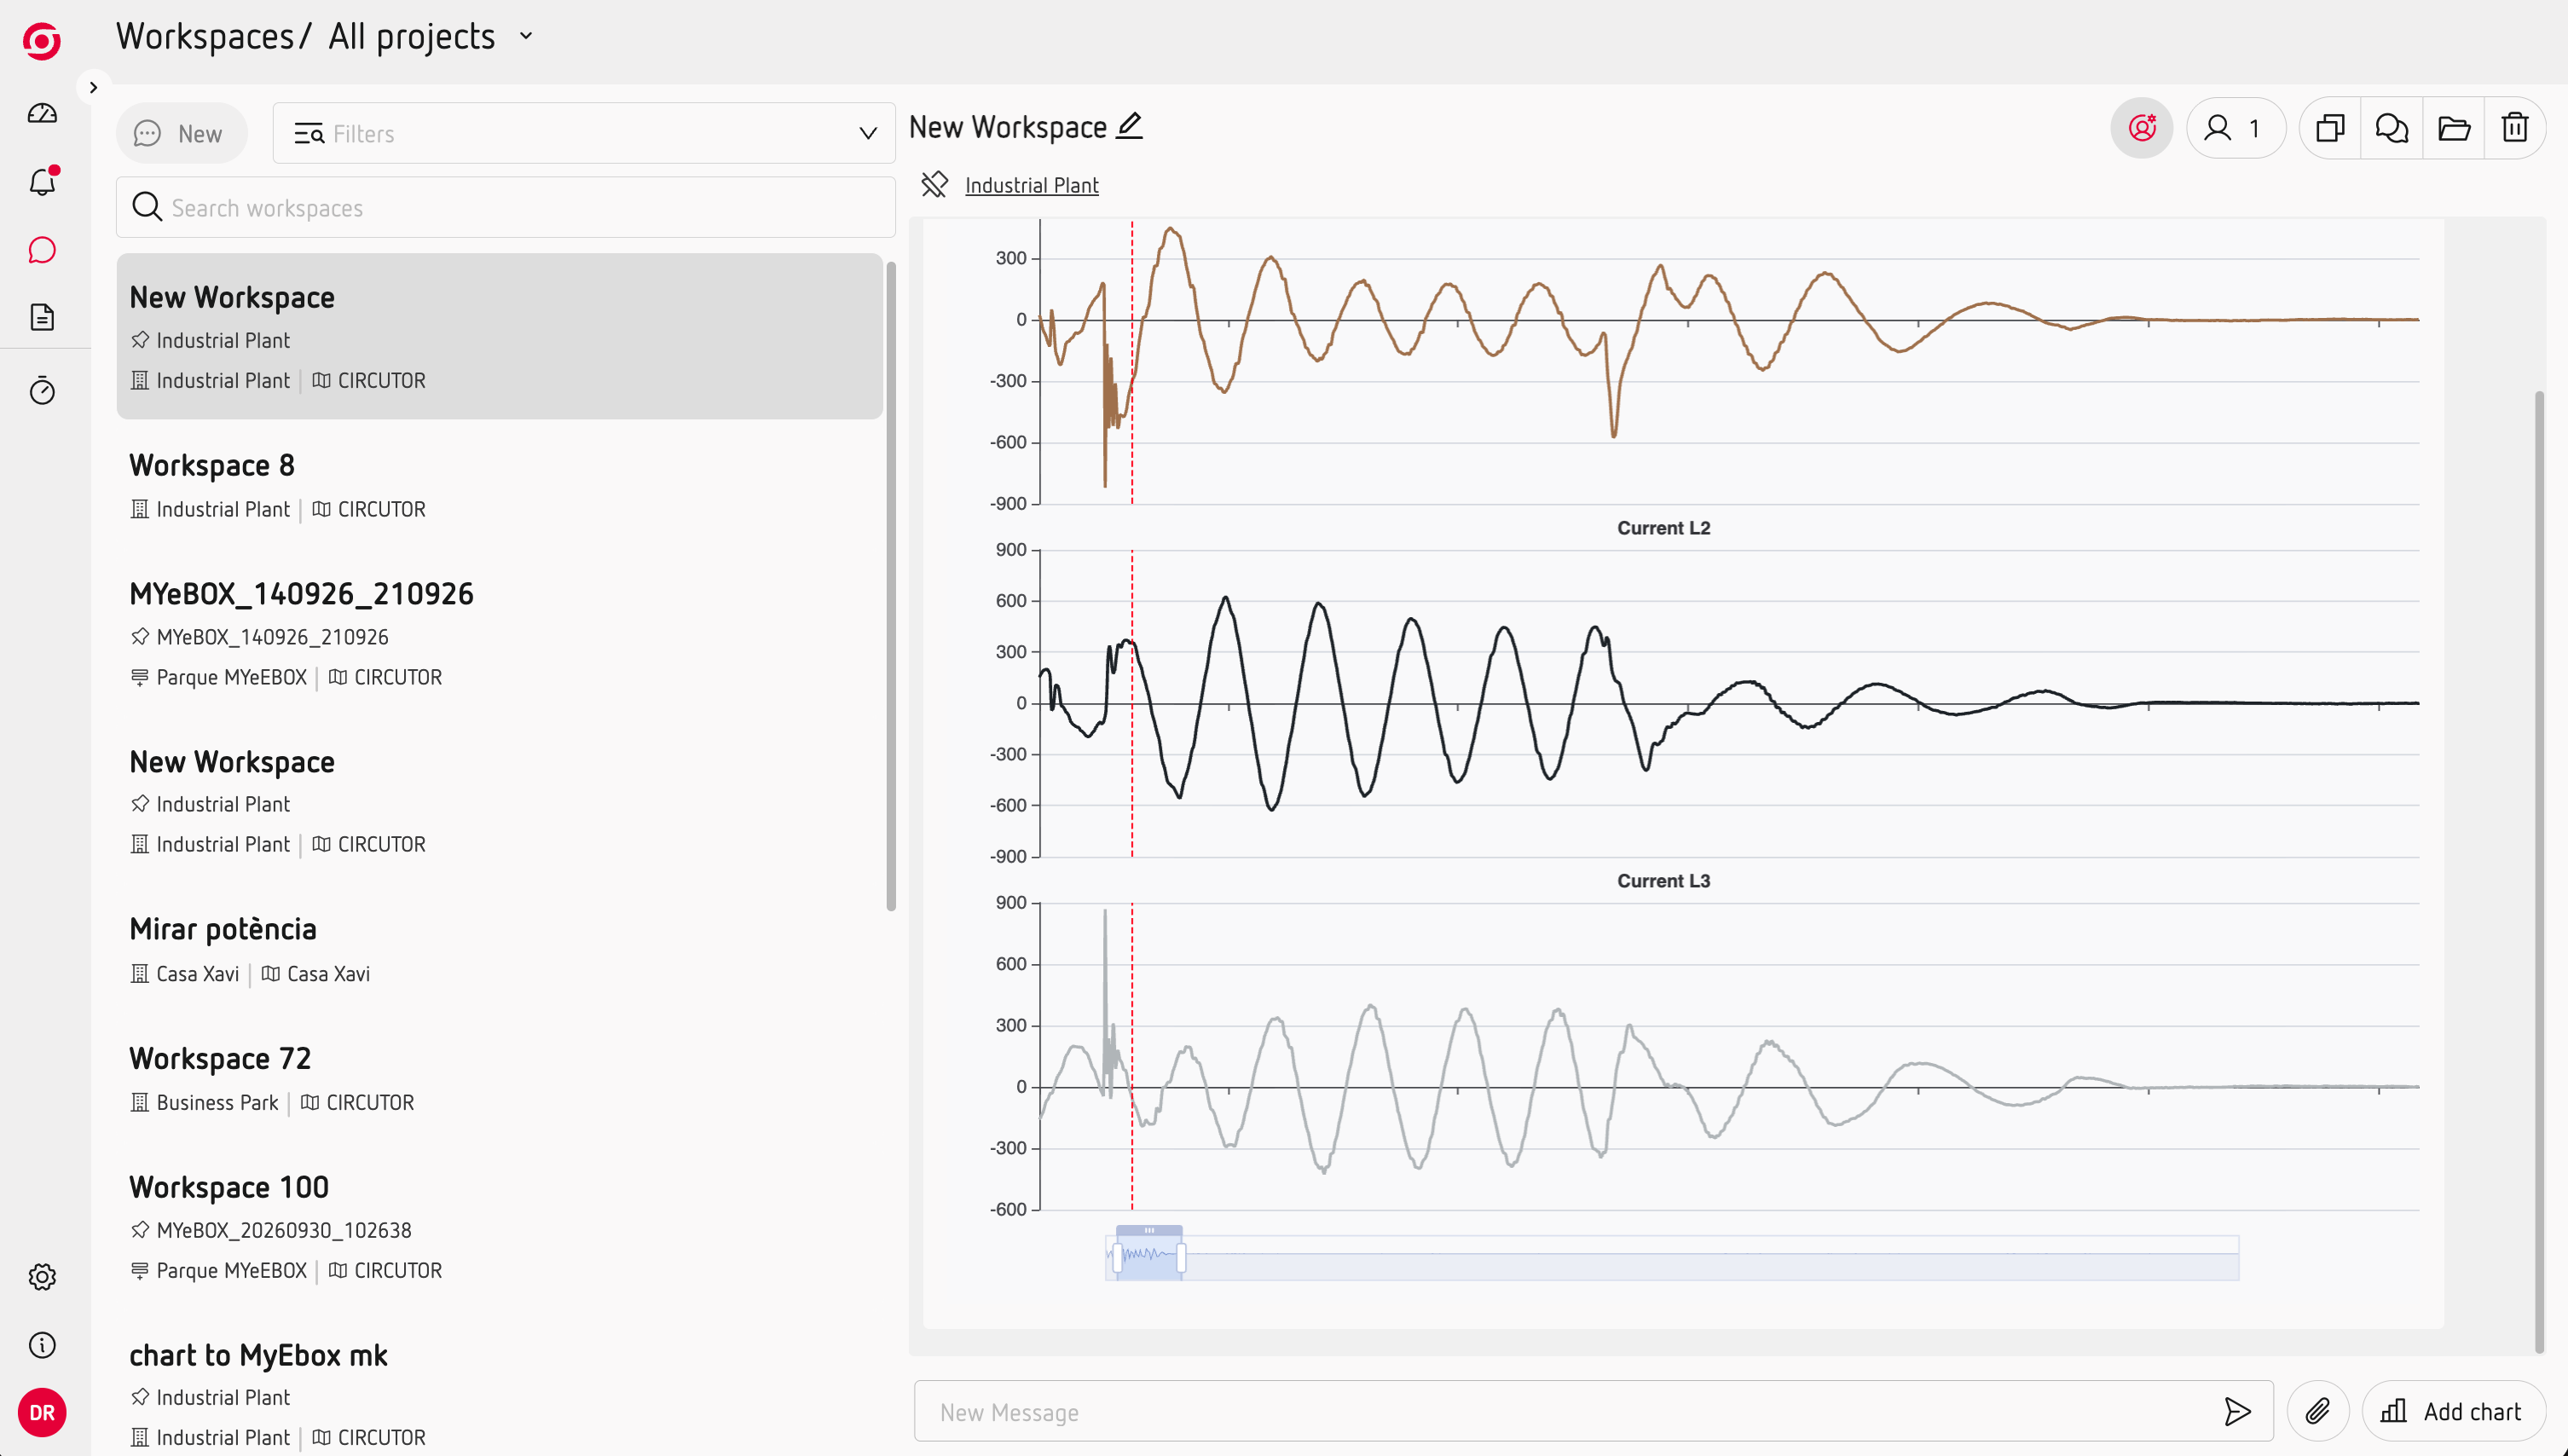
Analyse event waveforms
Use Waveforms to investigate what happened to voltage and current during a power quality event.
A power quality event tells you that something happened. The waveform helps you see what happened to the electrical signal during that event.
See the electrical behaviour
When a waveform is available, Scout lets you examine the recorded voltage and current signals around the event.
You can view:
- Voltage waveforms by phase.
- Current waveforms by phase.
- Voltage and current together to understand how they relate.
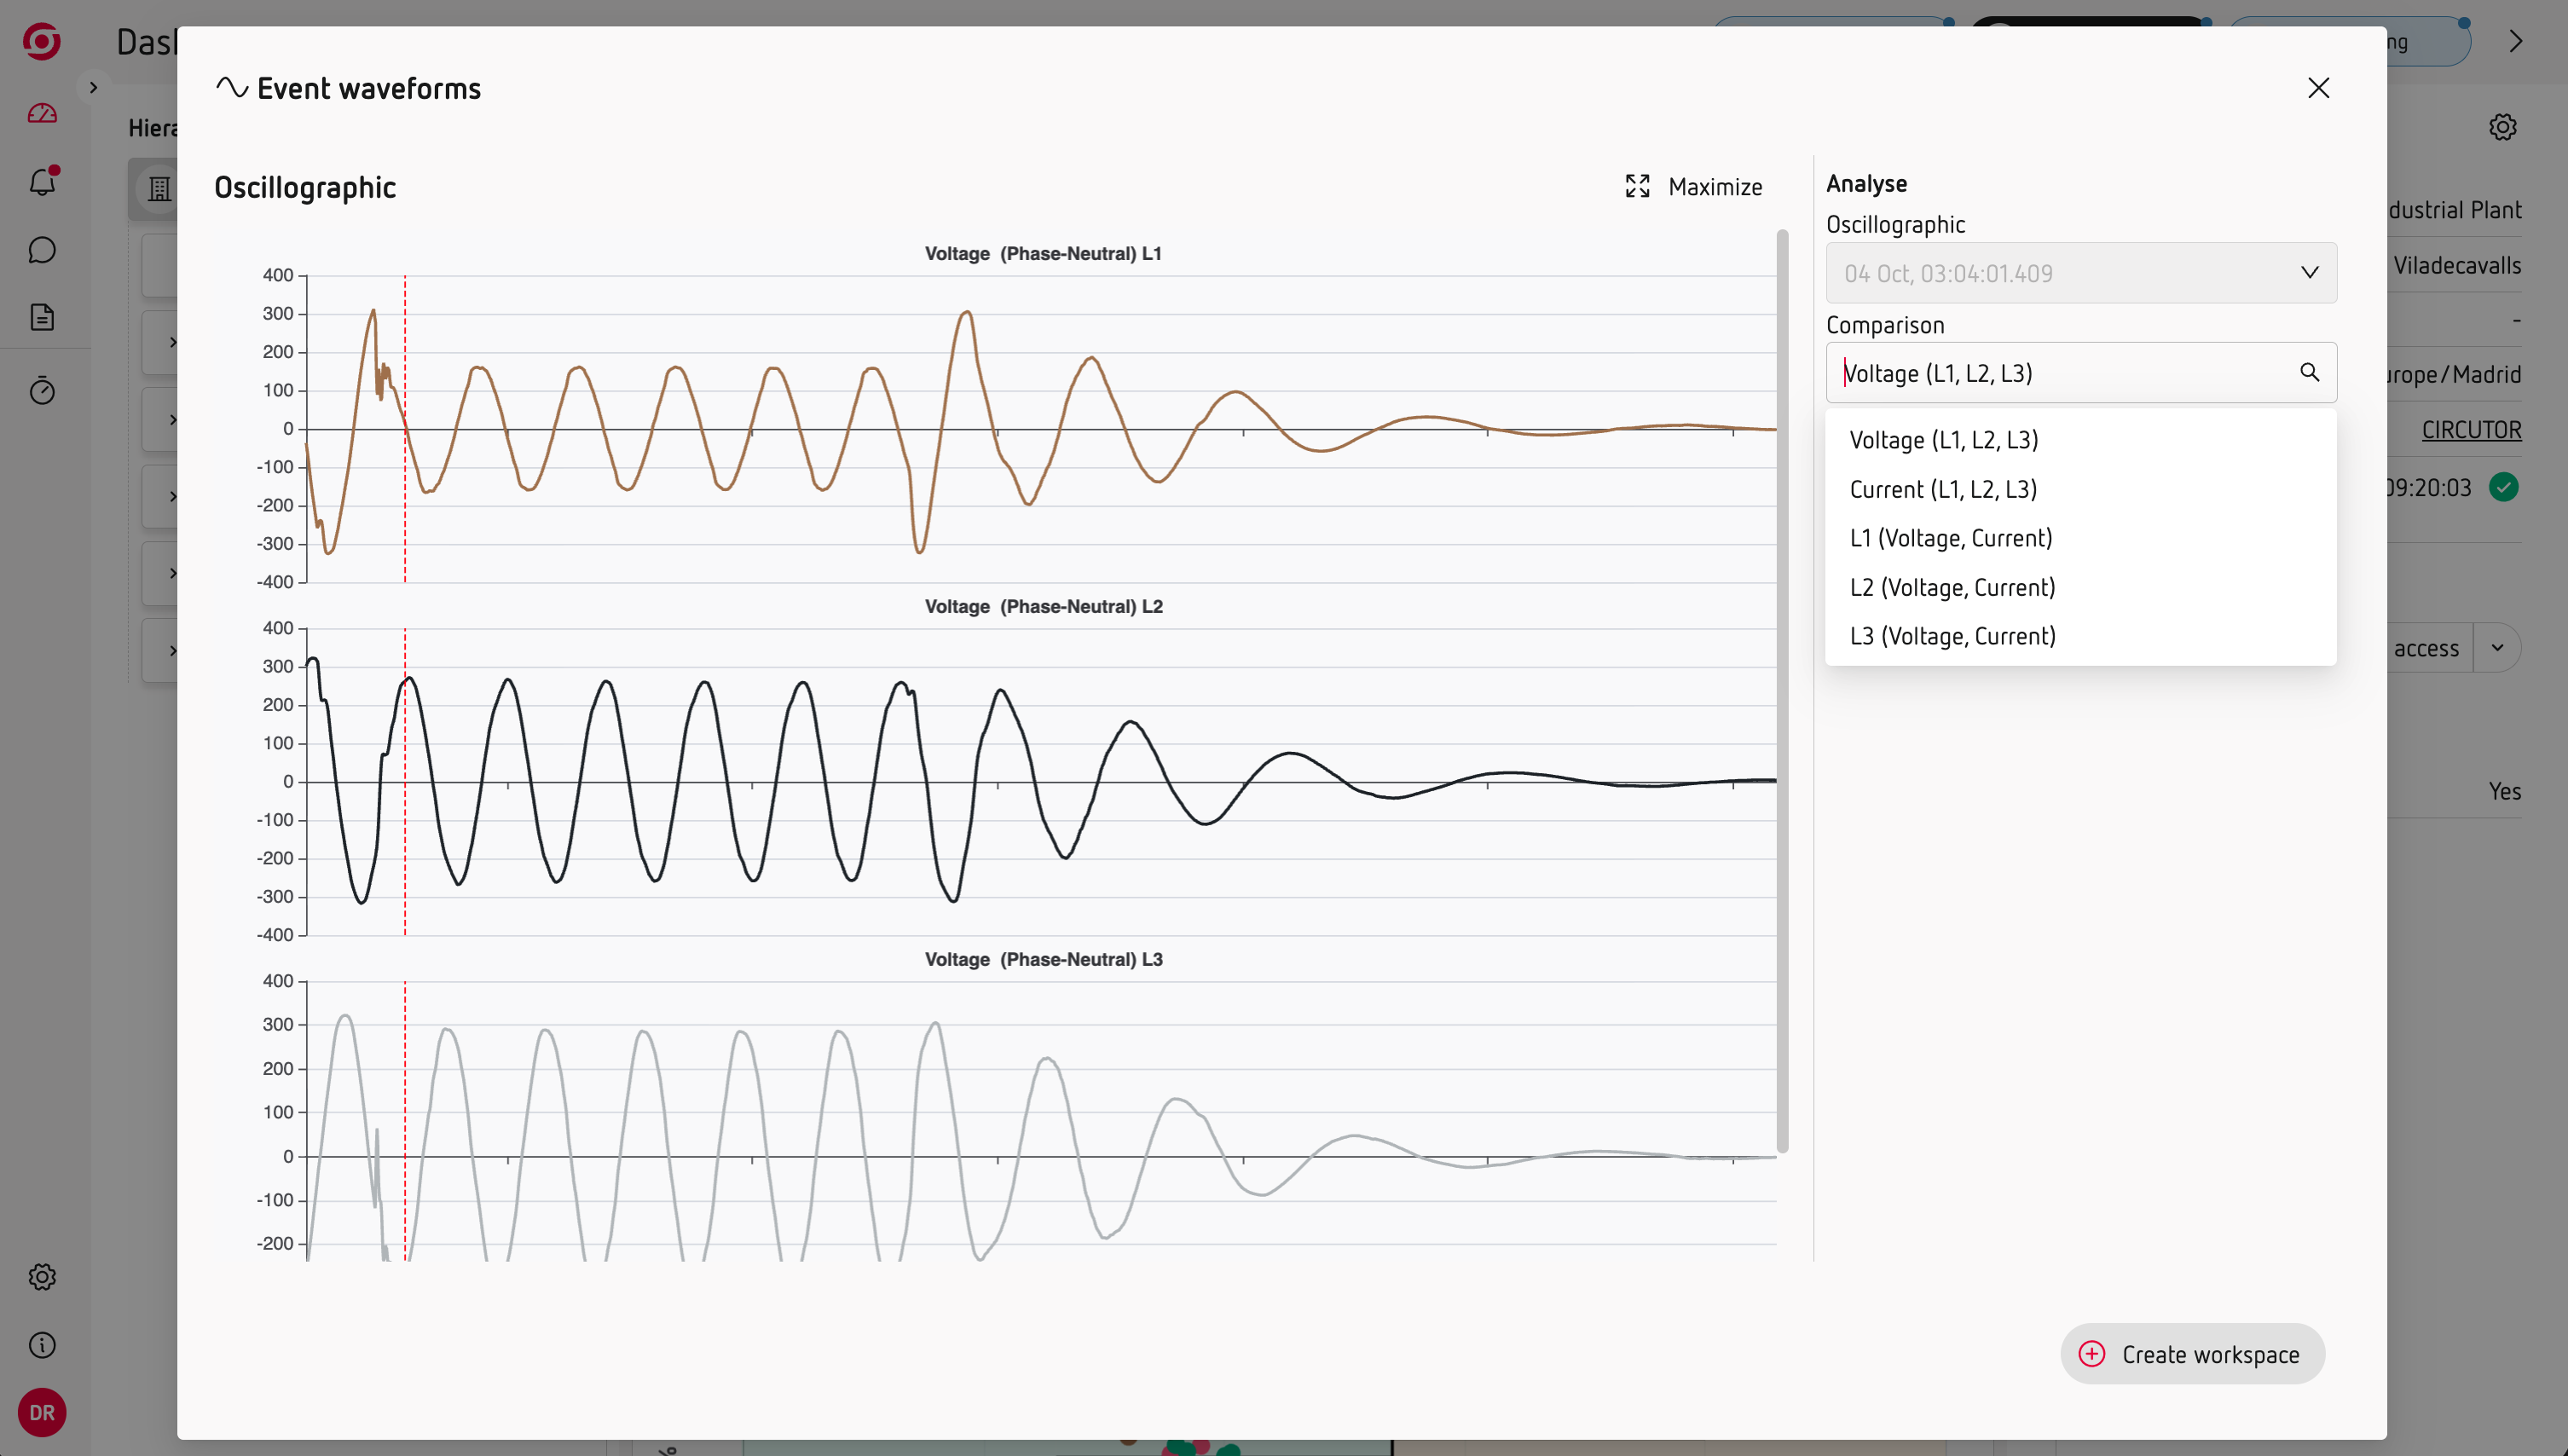
This can help you understand the behaviour of the installation during the event and provide more information for further investigation.
Analyse the event in a Workspace
When you need to look at the event in more detail, you can create a Workspace from the event.
The waveform can then be analysed together with other measurements and charts from the same period.
You can add notes or images to document what you find and share the analysis with your team.