Keep the data you need at hand
Create your own dashboard in Home and keep your most relevant data always at hand.
Scout's Home gives you a live view of the data that matters most to your installation.
Add the charts and measurements you use most often so you can see the latest information as soon as you open your project.
Build your own dashboard
You can add and organise charts in Home to create a view that fits your installation and your needs.
Choose the measurements, consumption data or other information you want to monitor and arrange them so the most relevant data is always easy to find.
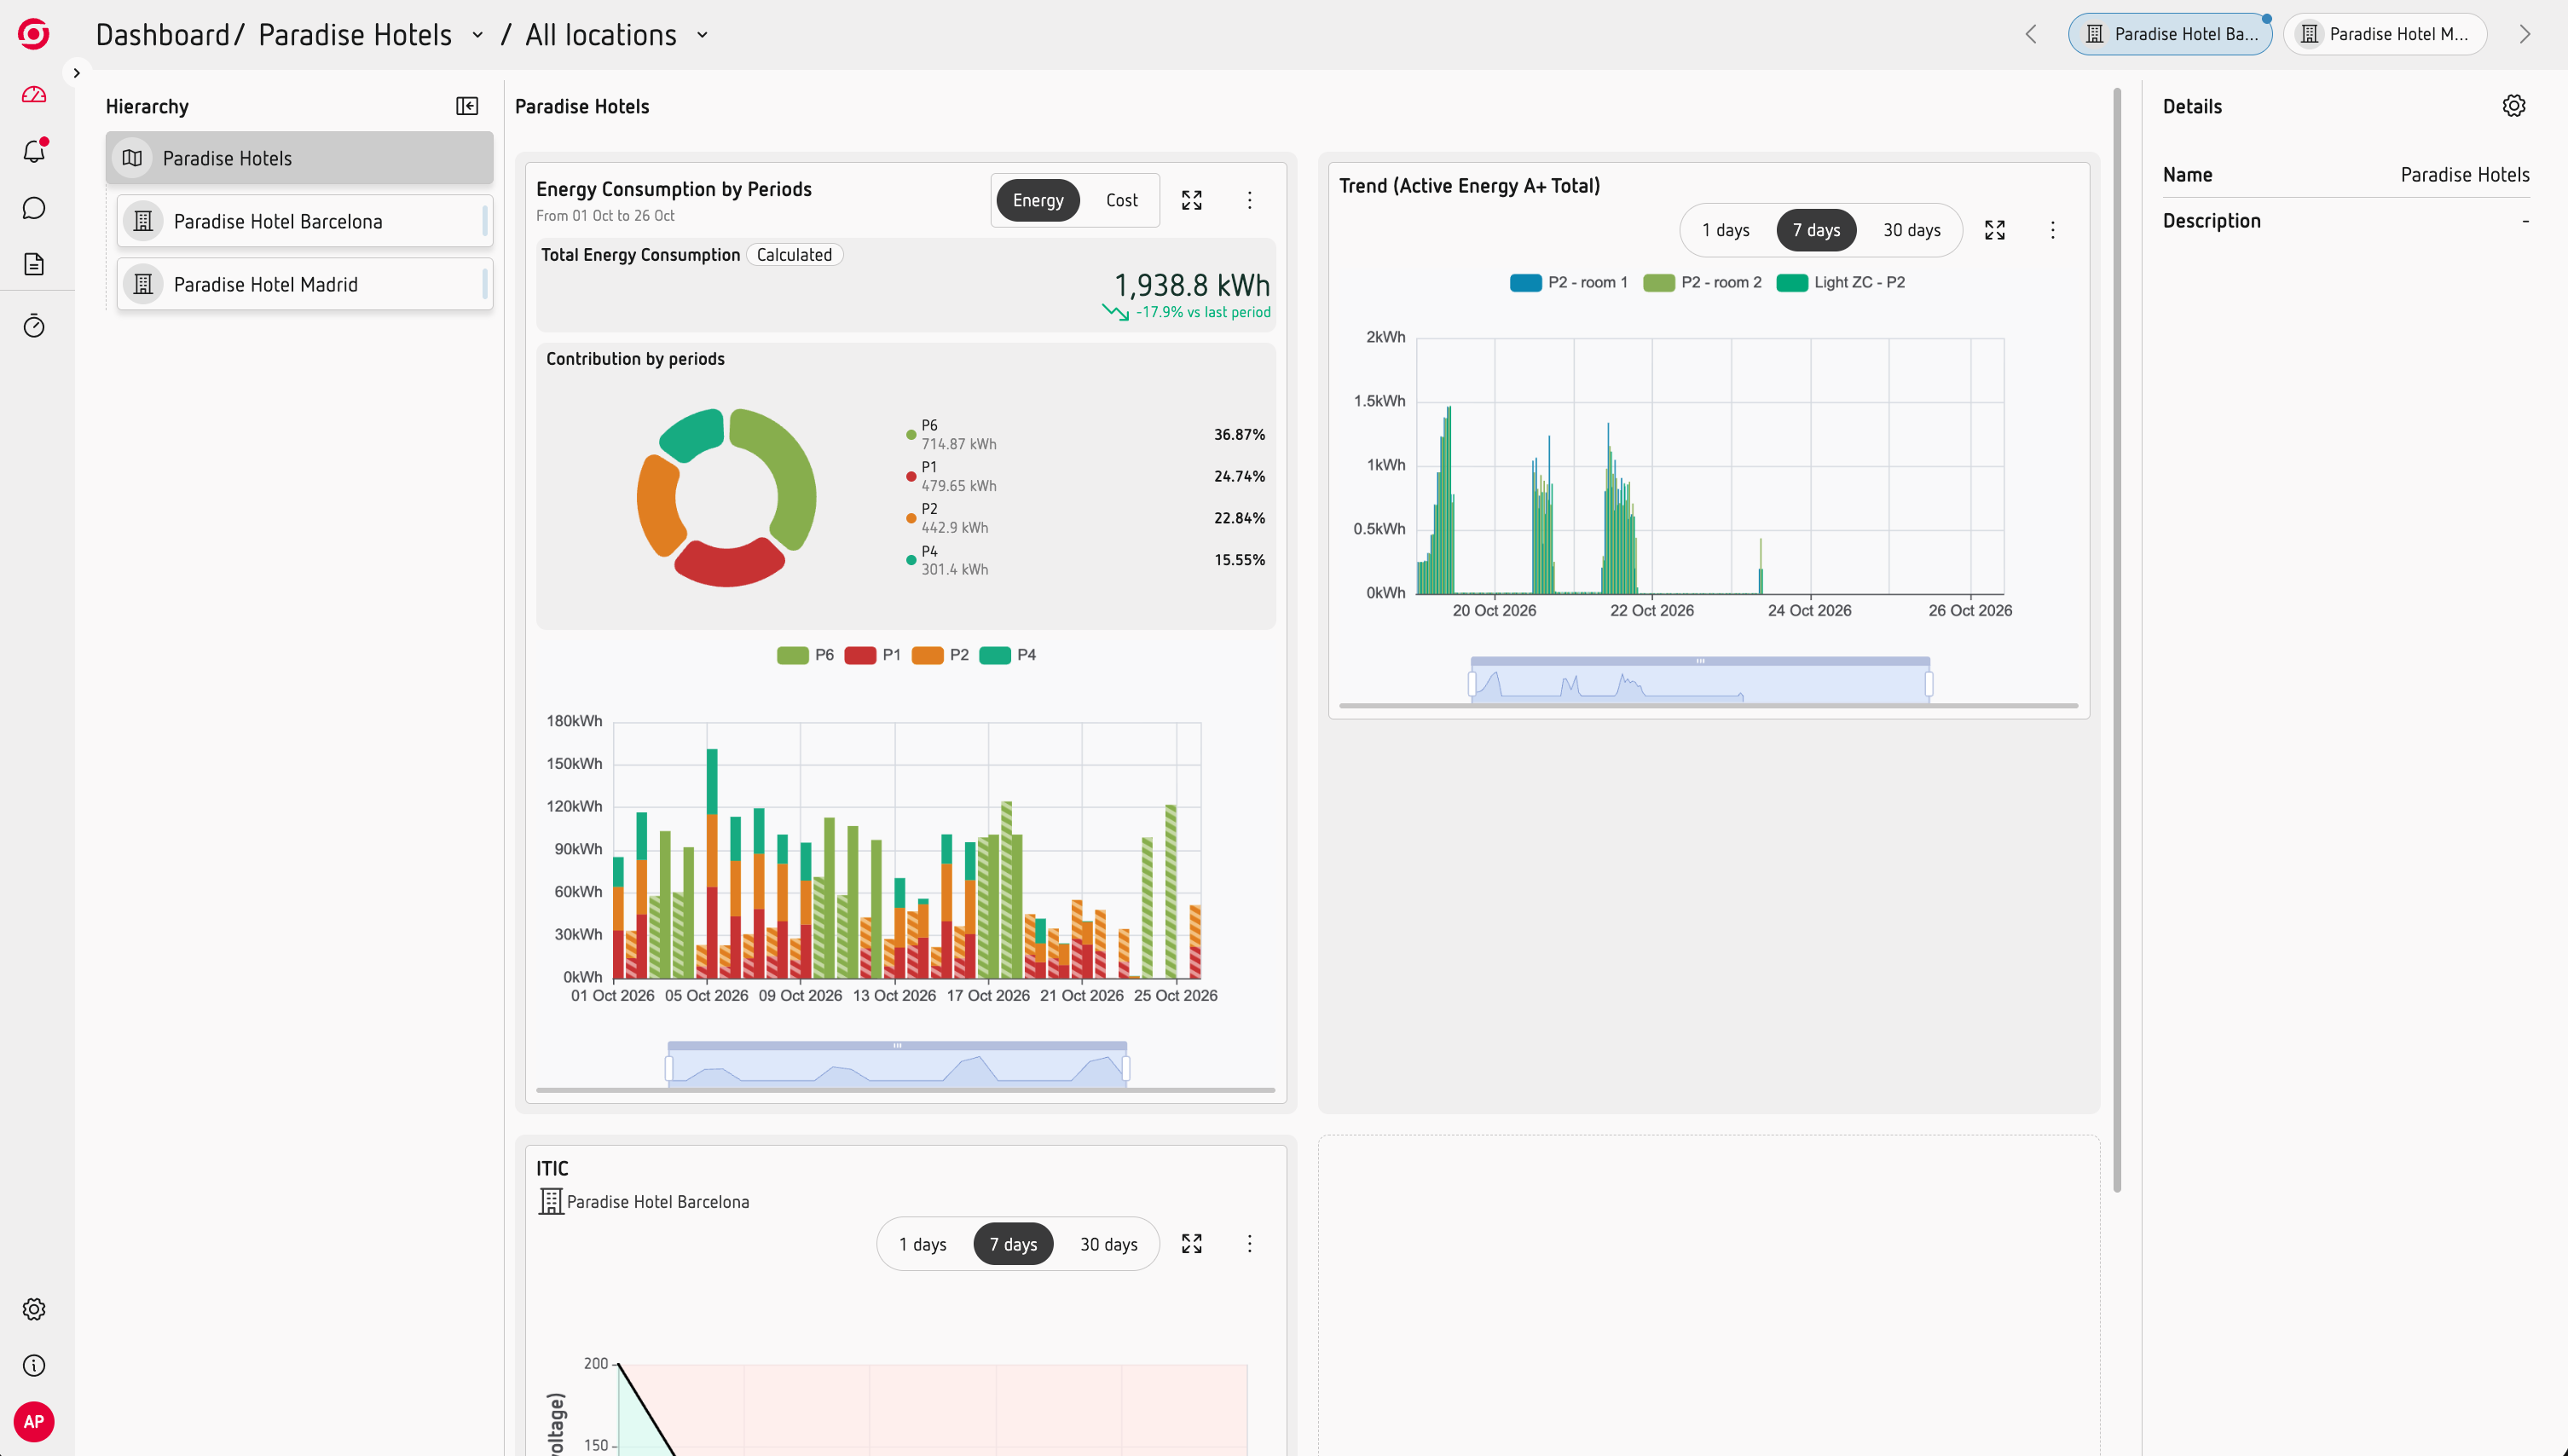
The charts show the latest available data, so your dashboard stays up to date as new measurements arrive.
Use different charts for different needs
You can combine different types of information in the same dashboard.
For example, you could keep:
- Key electrical measurements.
- Energy consumption.
- Water or gas consumption.
- Power quality information.
- Other measurements that are important to your installation.
Go further
Use Home to keep an eye on your installation. When you need to investigate a specific period or analyse something in more detail, use a Workspace.