Investigate power quality events
Use Quality Event Charts to identify and investigate power quality events in your installation.
Scout helps you see when a power quality event has occurred, understand its relevance and investigate what happened.
See power quality events at a glance
The Quality Event Chart shows power quality events on a timeline and classifies them by event type.
Events are also represented according to the ITIC curve, helping you quickly identify which events may be relevant.
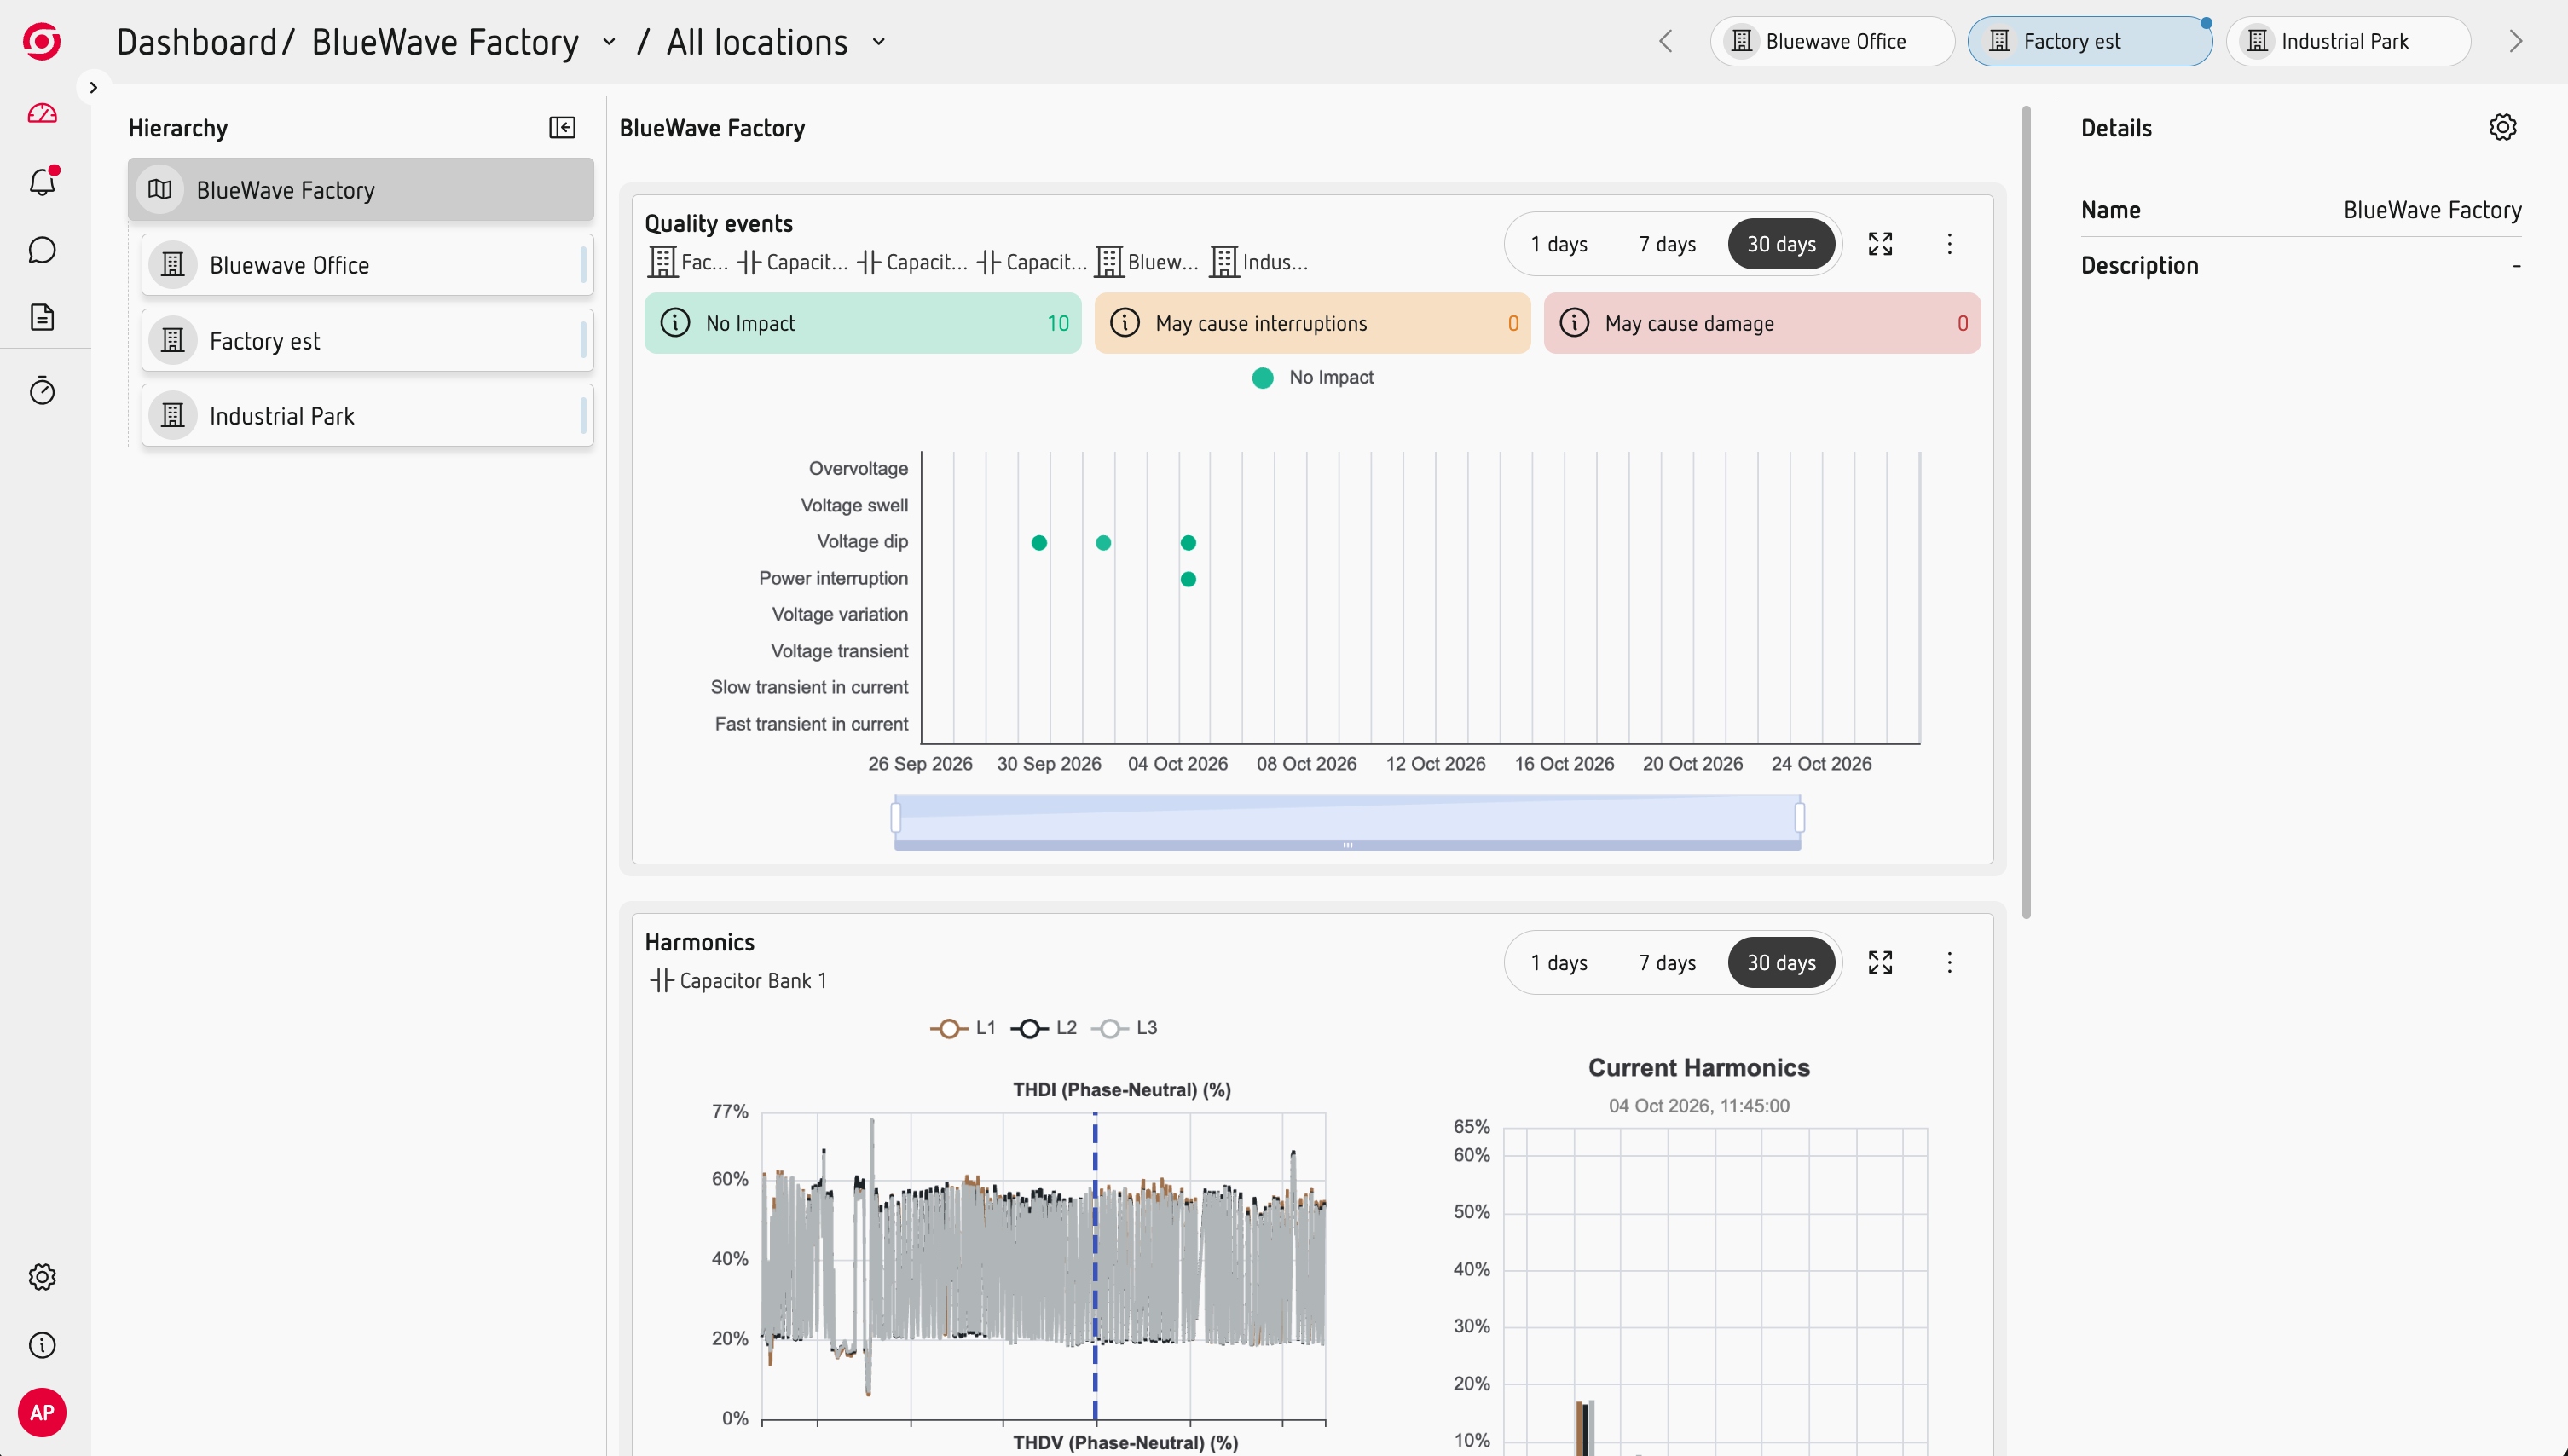
This gives you a quick overview of the power quality behaviour of your installation and helps you focus on the events that need further investigation.
Investigate an event
Select an event to see its details and understand what happened.
Depending on the event, you can access its ITIC classification and the recorded waveform.
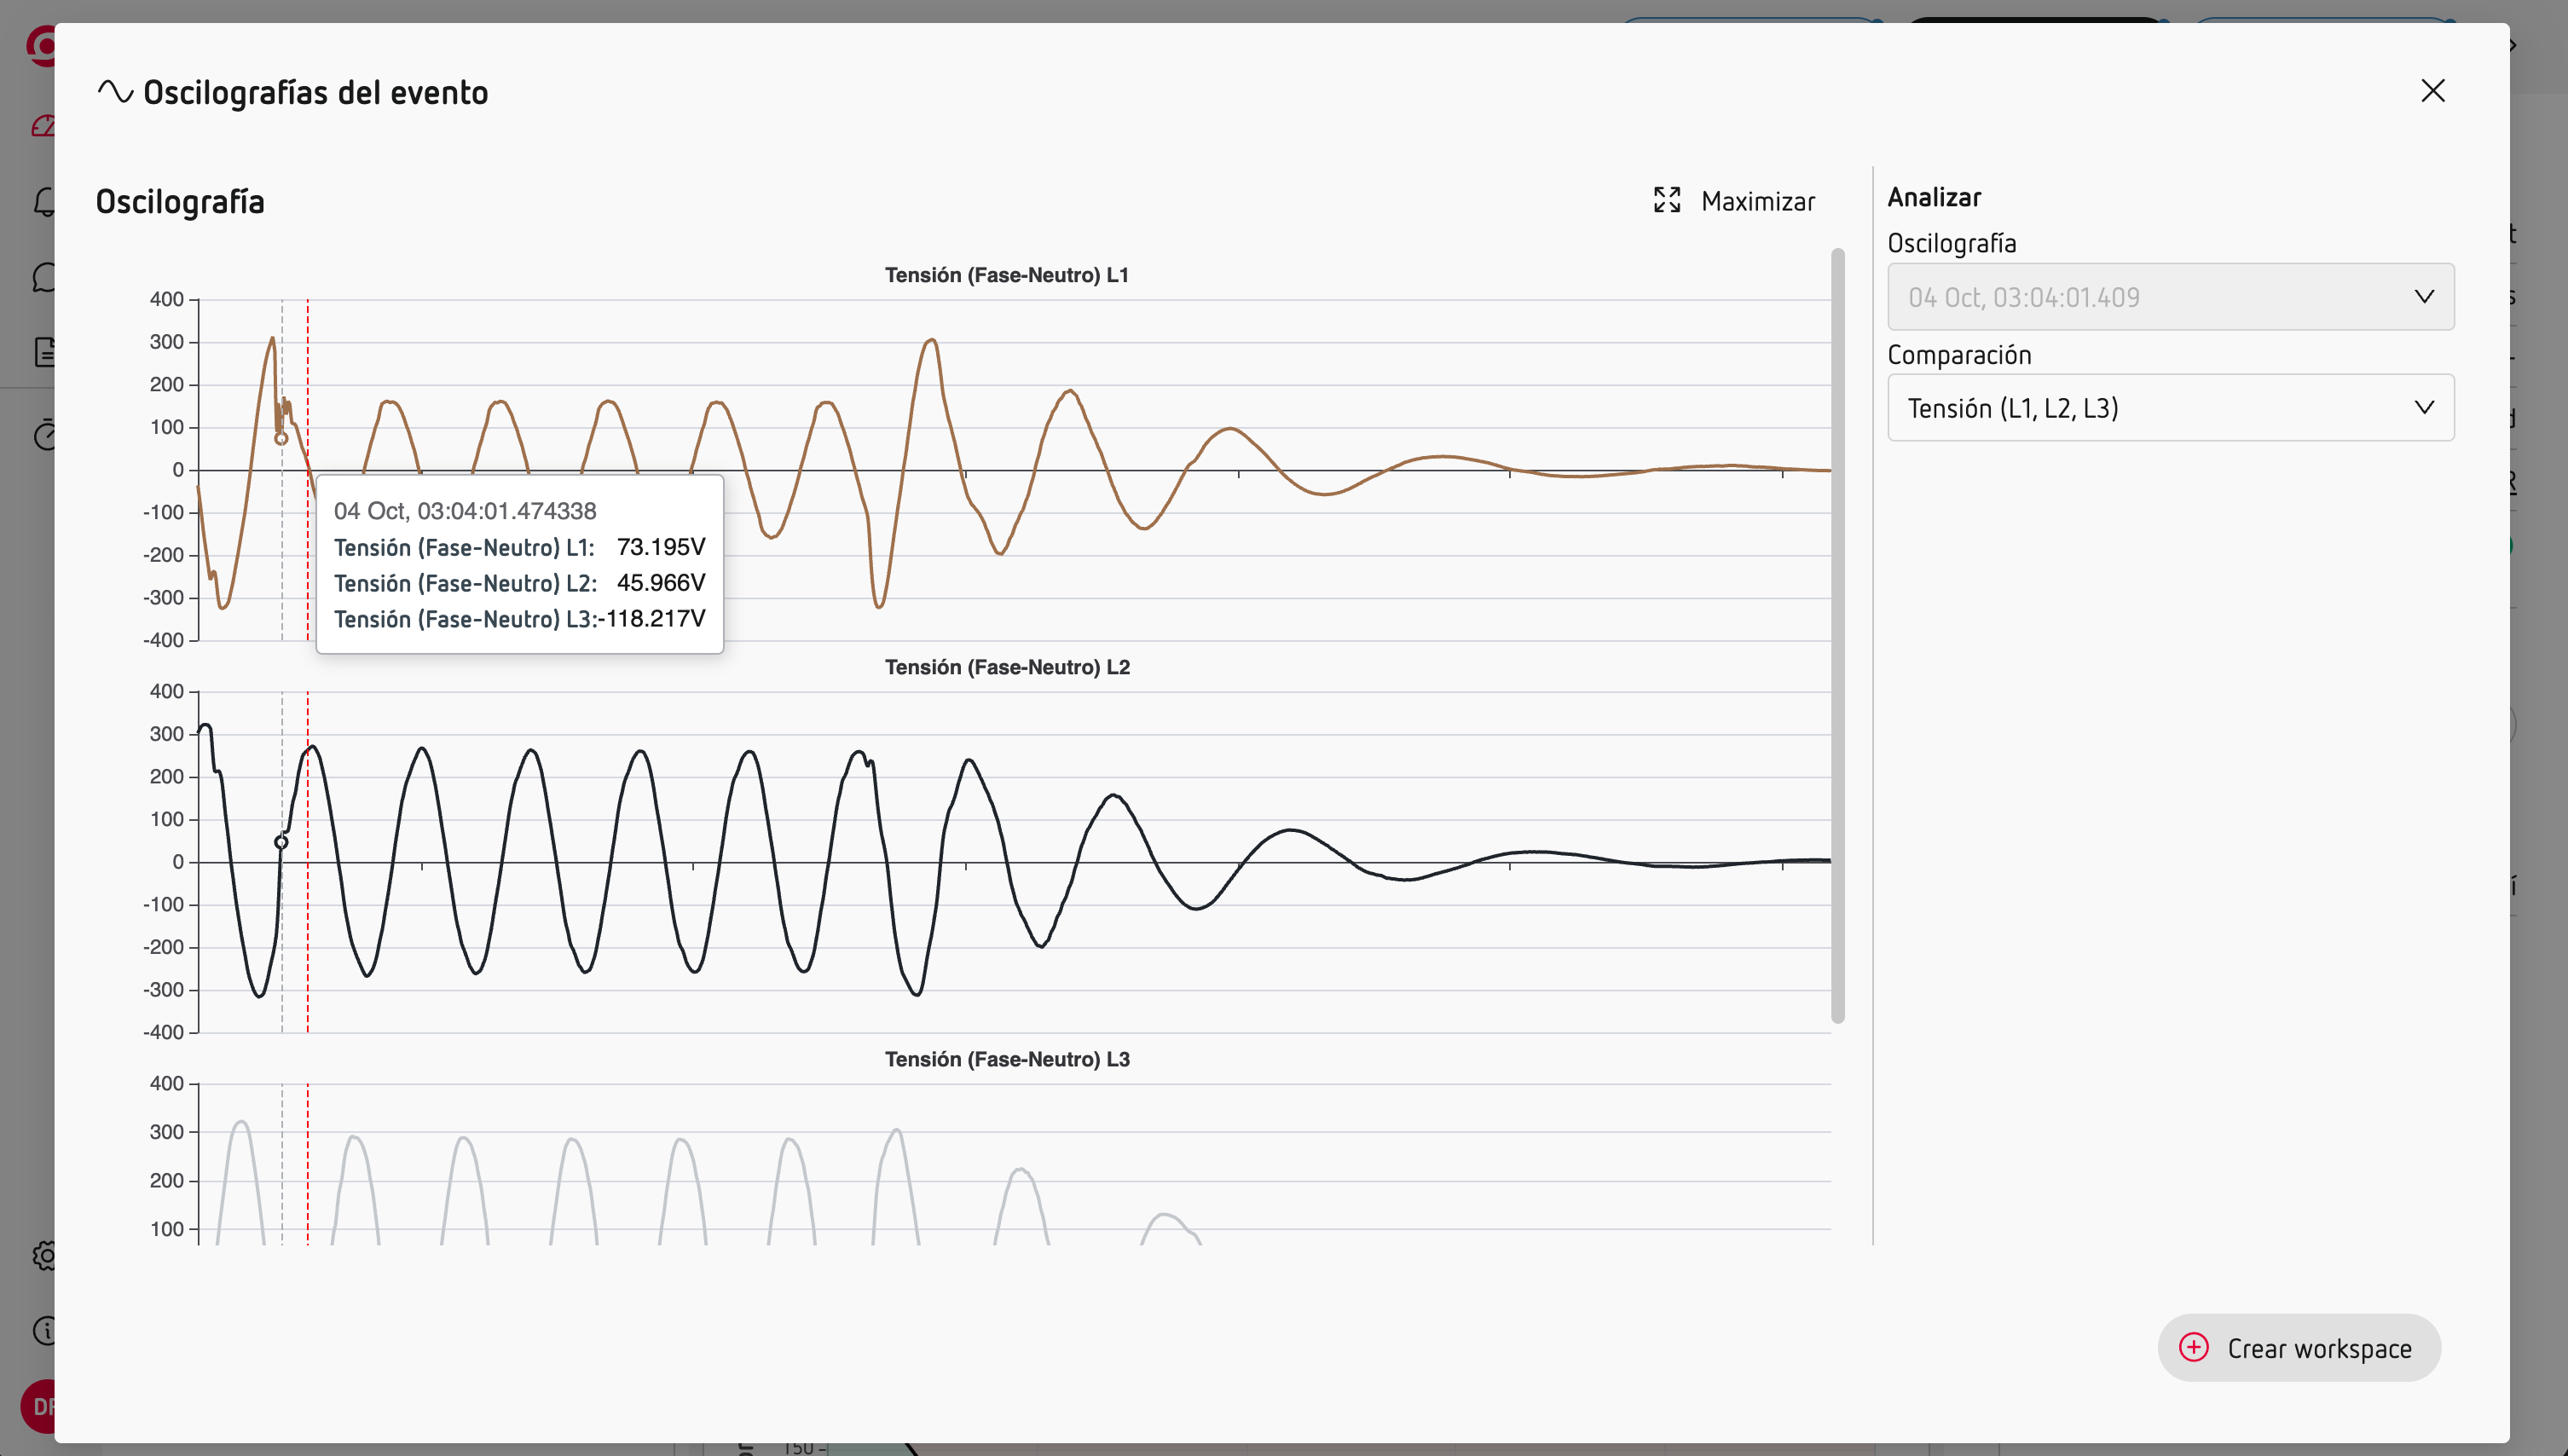
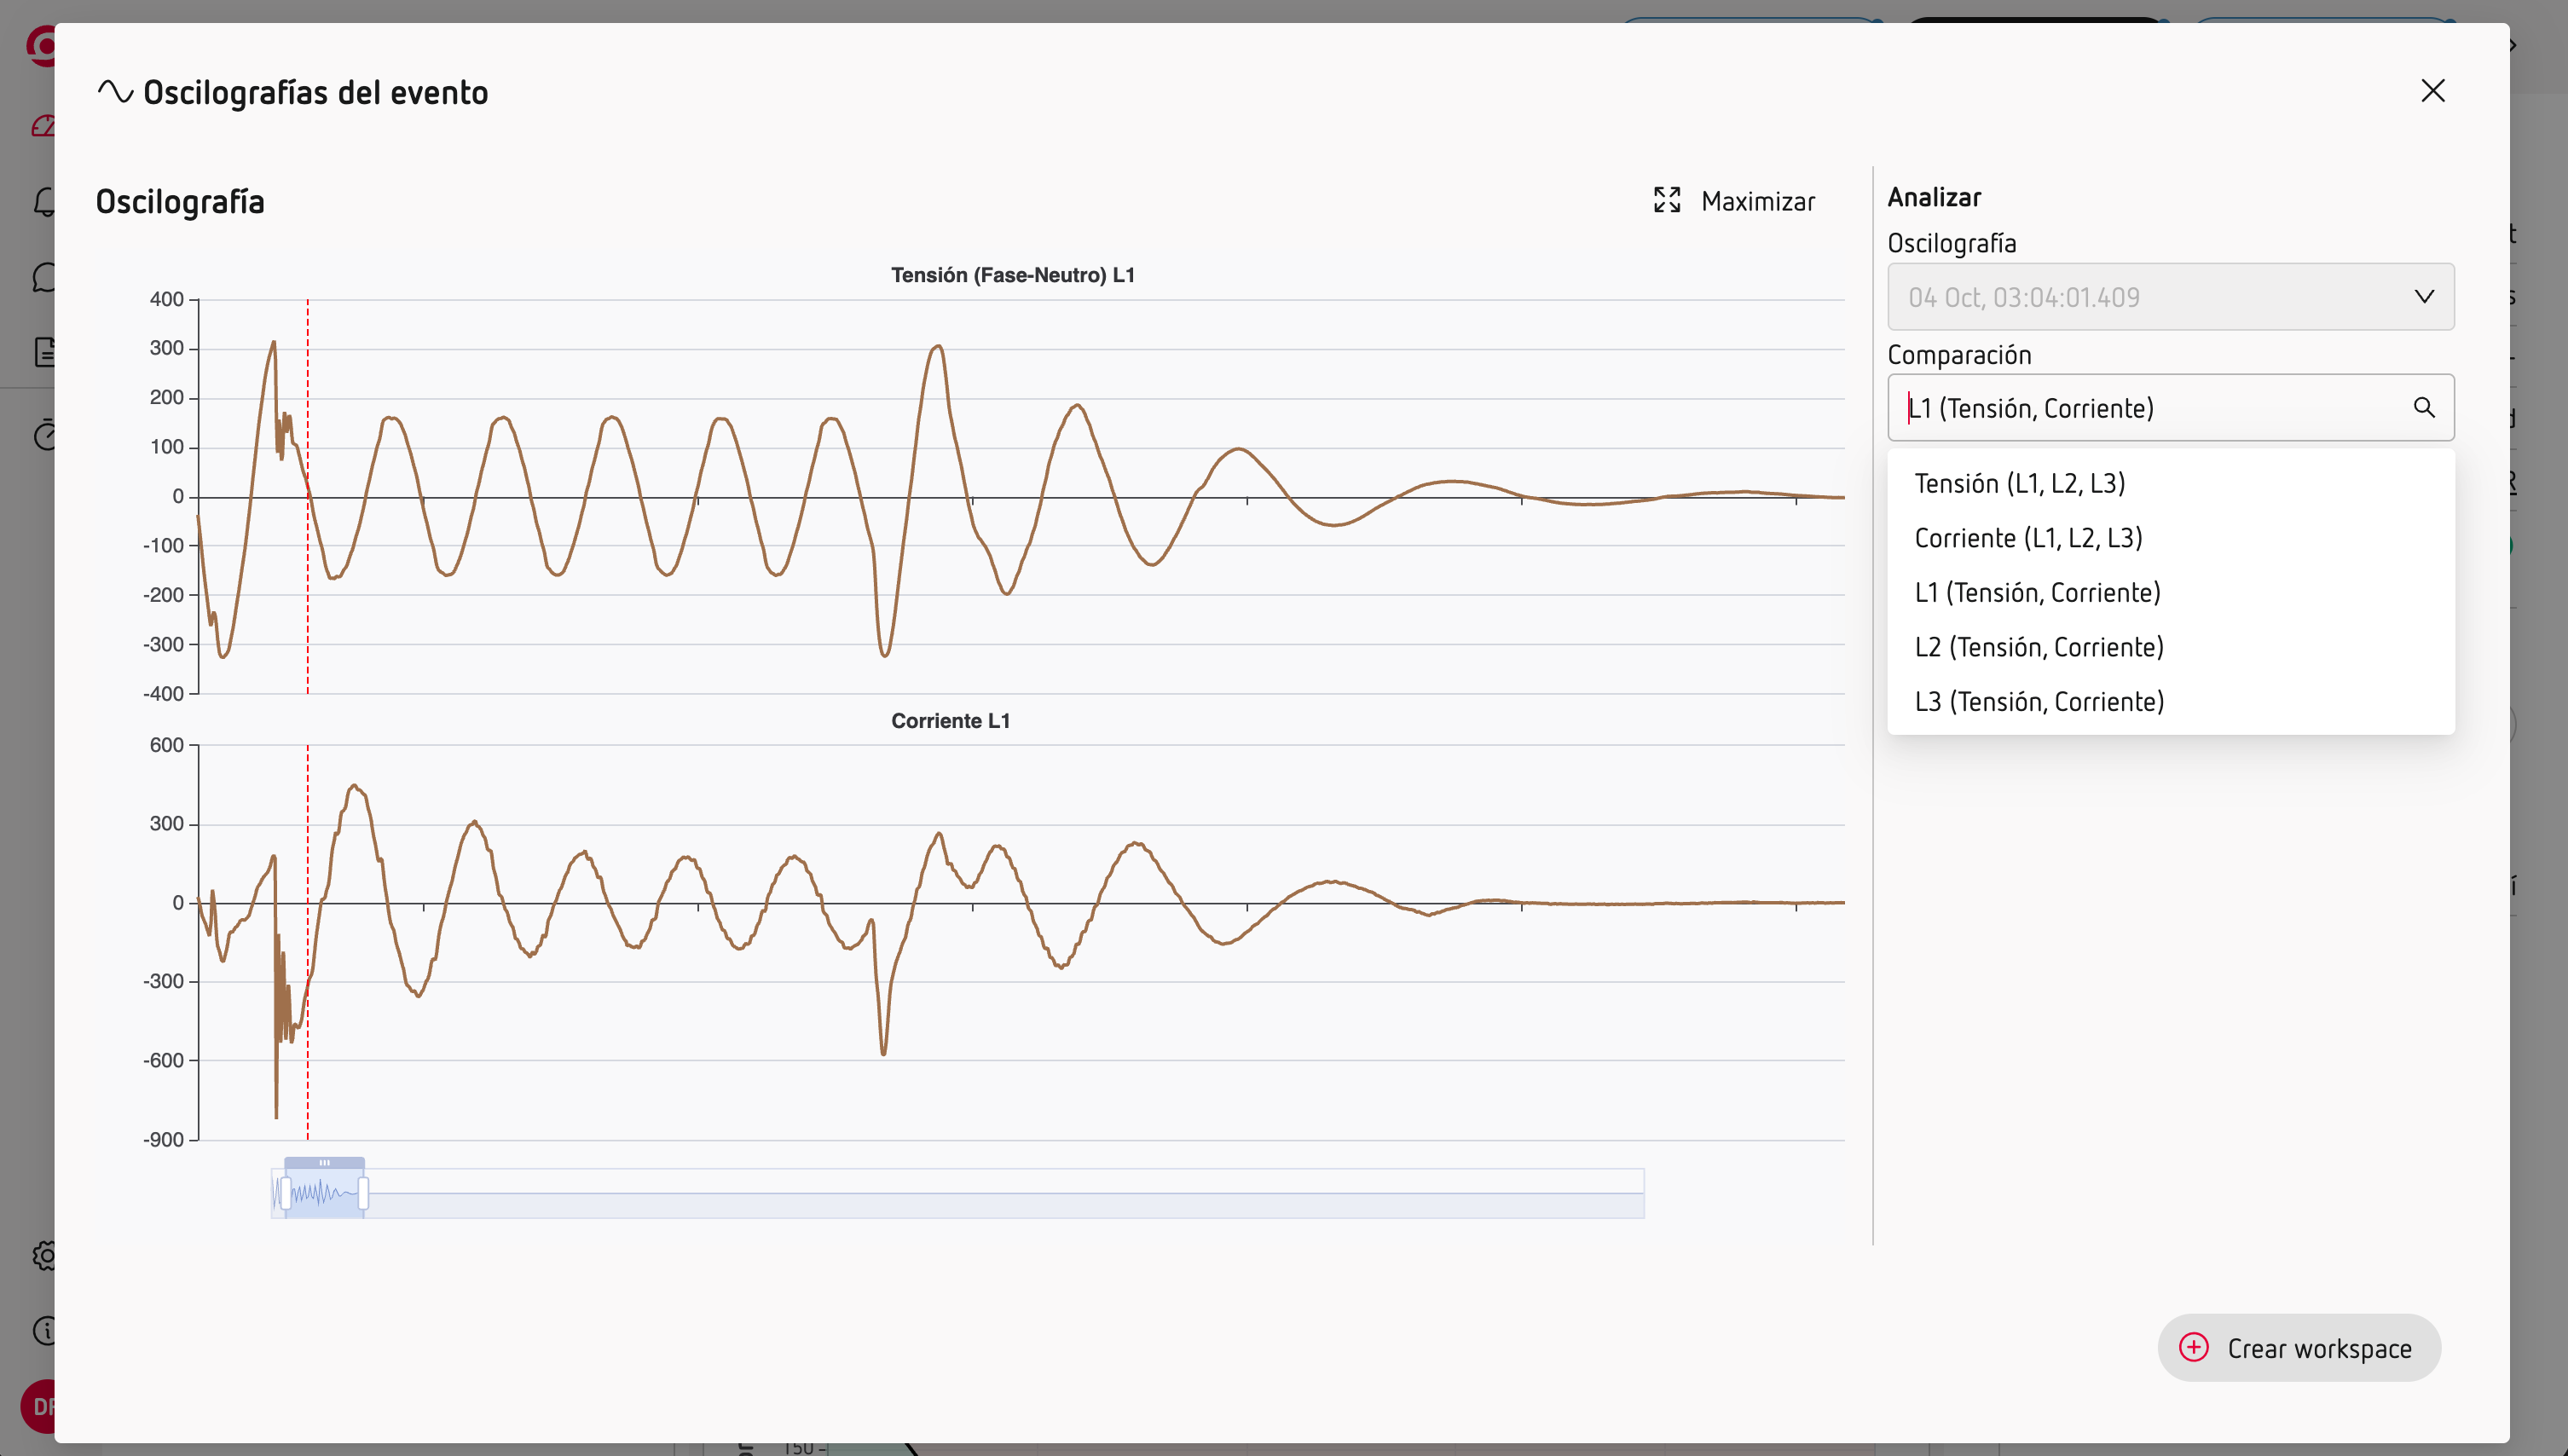
The waveform lets you investigate the electrical behaviour during the event. You can view:
- Voltage waveforms.
- Current waveforms.
- Voltage and current together for each phase.
Analyse the event in context
When you need to investigate further, you can create a Workspace directly from the event.
This gives you a fixed view of the relevant period, where you can add other measurements, charts, text or images to understand what was happening around the event.