Analyse measurements over time
Use Trend Charts to understand how an electrical measurement changes over time.
Looking at a measurement at a single point in time is useful. Seeing how it evolves can help you identify trends, changes and unusual behaviour.
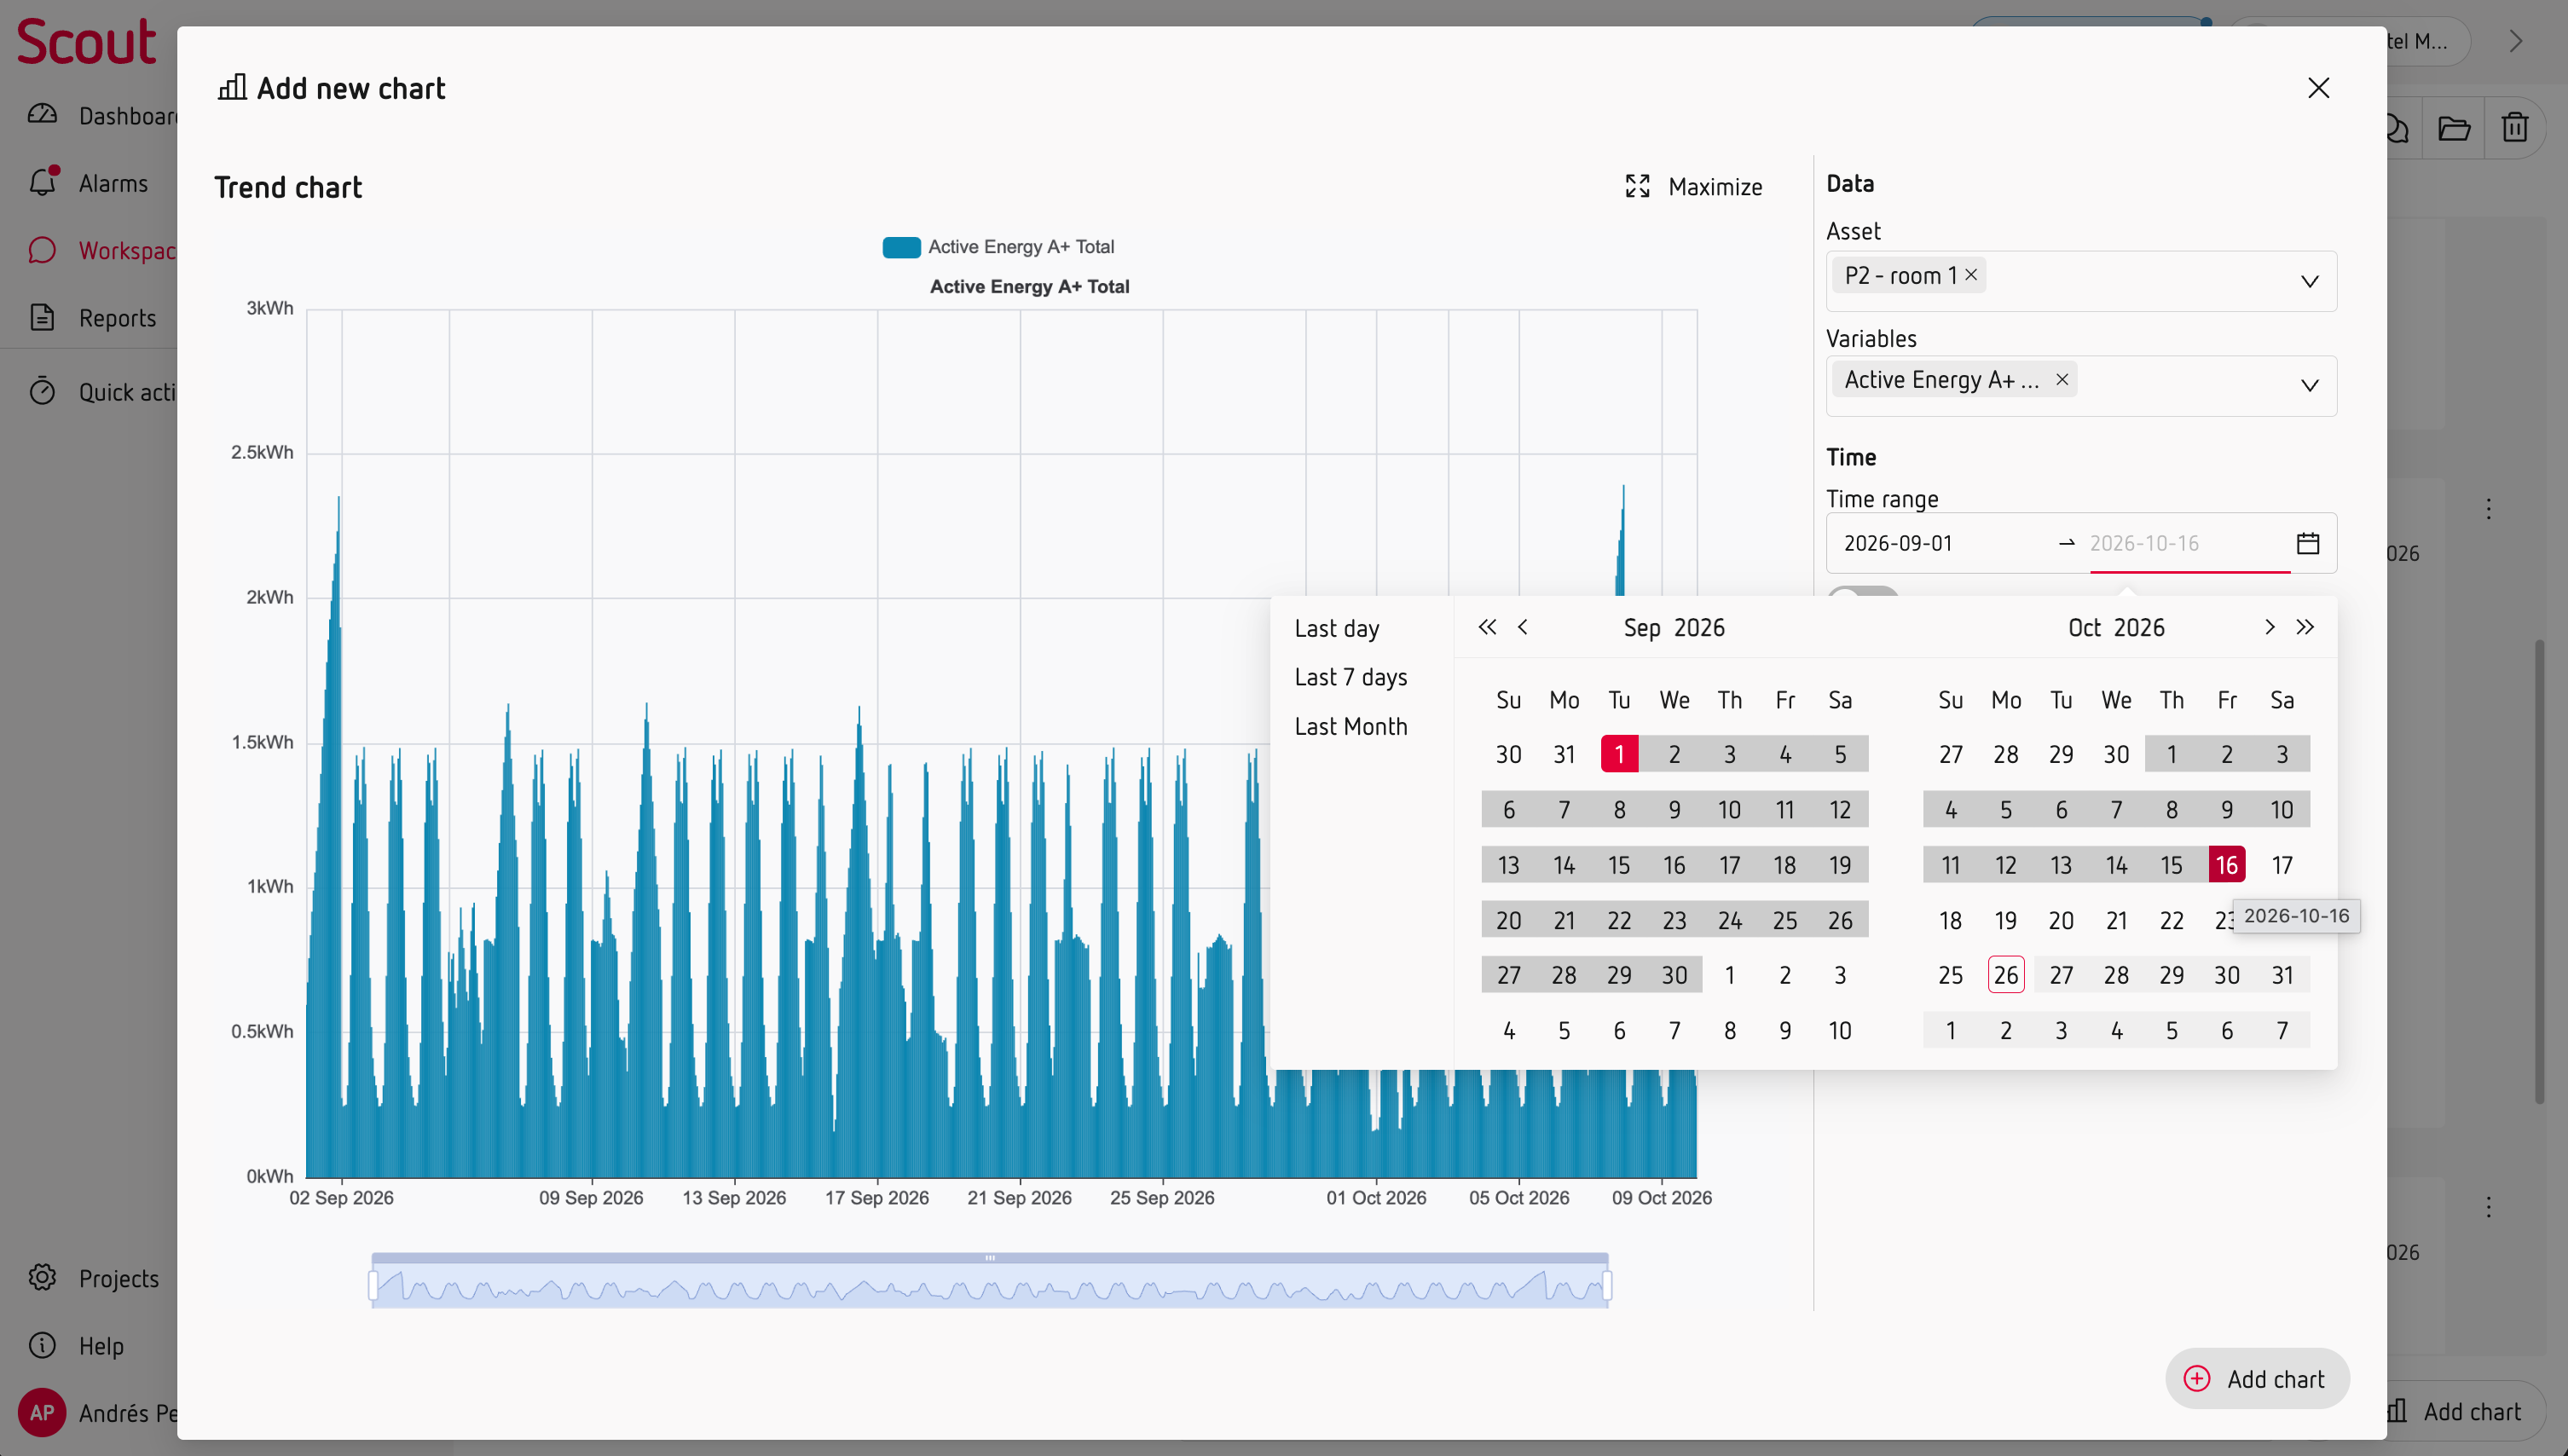
Choose the period you want to analyse
Add a Trend Chart to a Workspace and select the period you want to investigate.
You can analyse a specific period of your installation and focus on the measurements that are relevant to your question.
Look for changes and patterns
Analysing measurements over time can help you:
- Identify changes in electrical behaviour.
- Find unusual peaks or variations.
- Understand when a problem started.
- Check what happened before or after an event.
- Evaluate the effect of a change in your installation.
Compare measurements
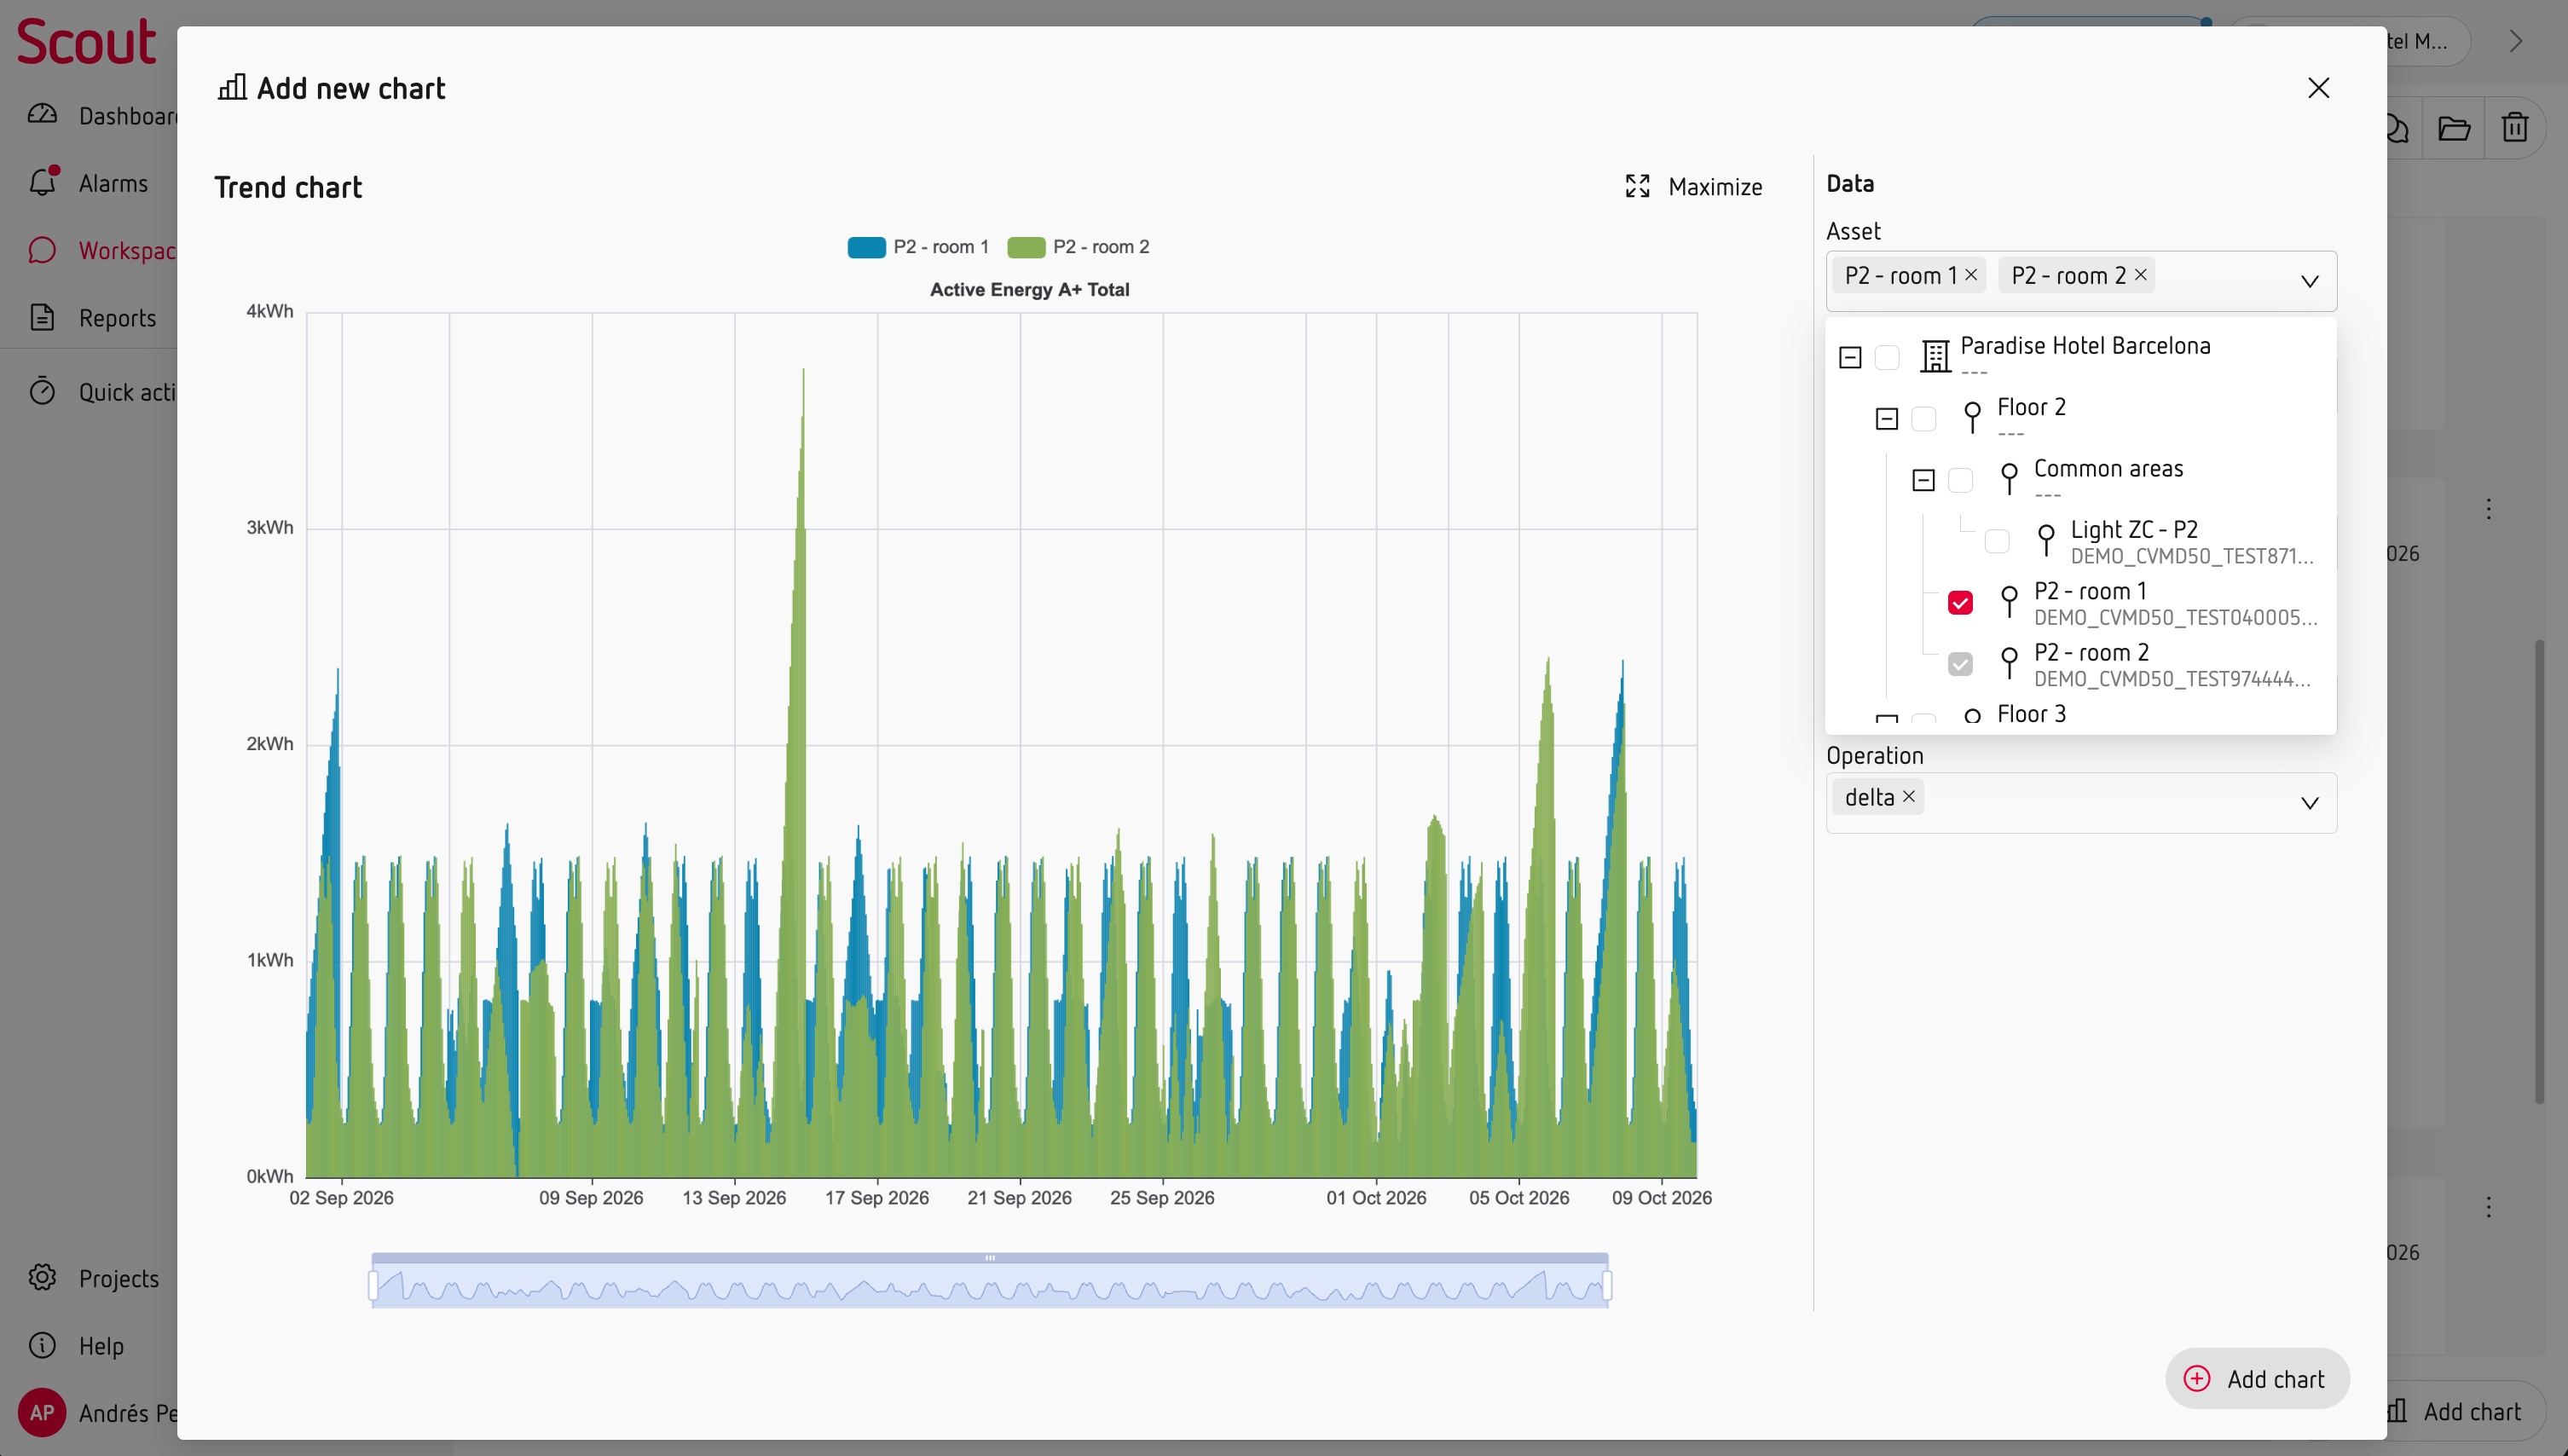
Use several Trend Charts together to compare how different measurements or Assets behave during the same period.
For example, you can compare voltage and current, or look at the same measurement in different parts of your installation.
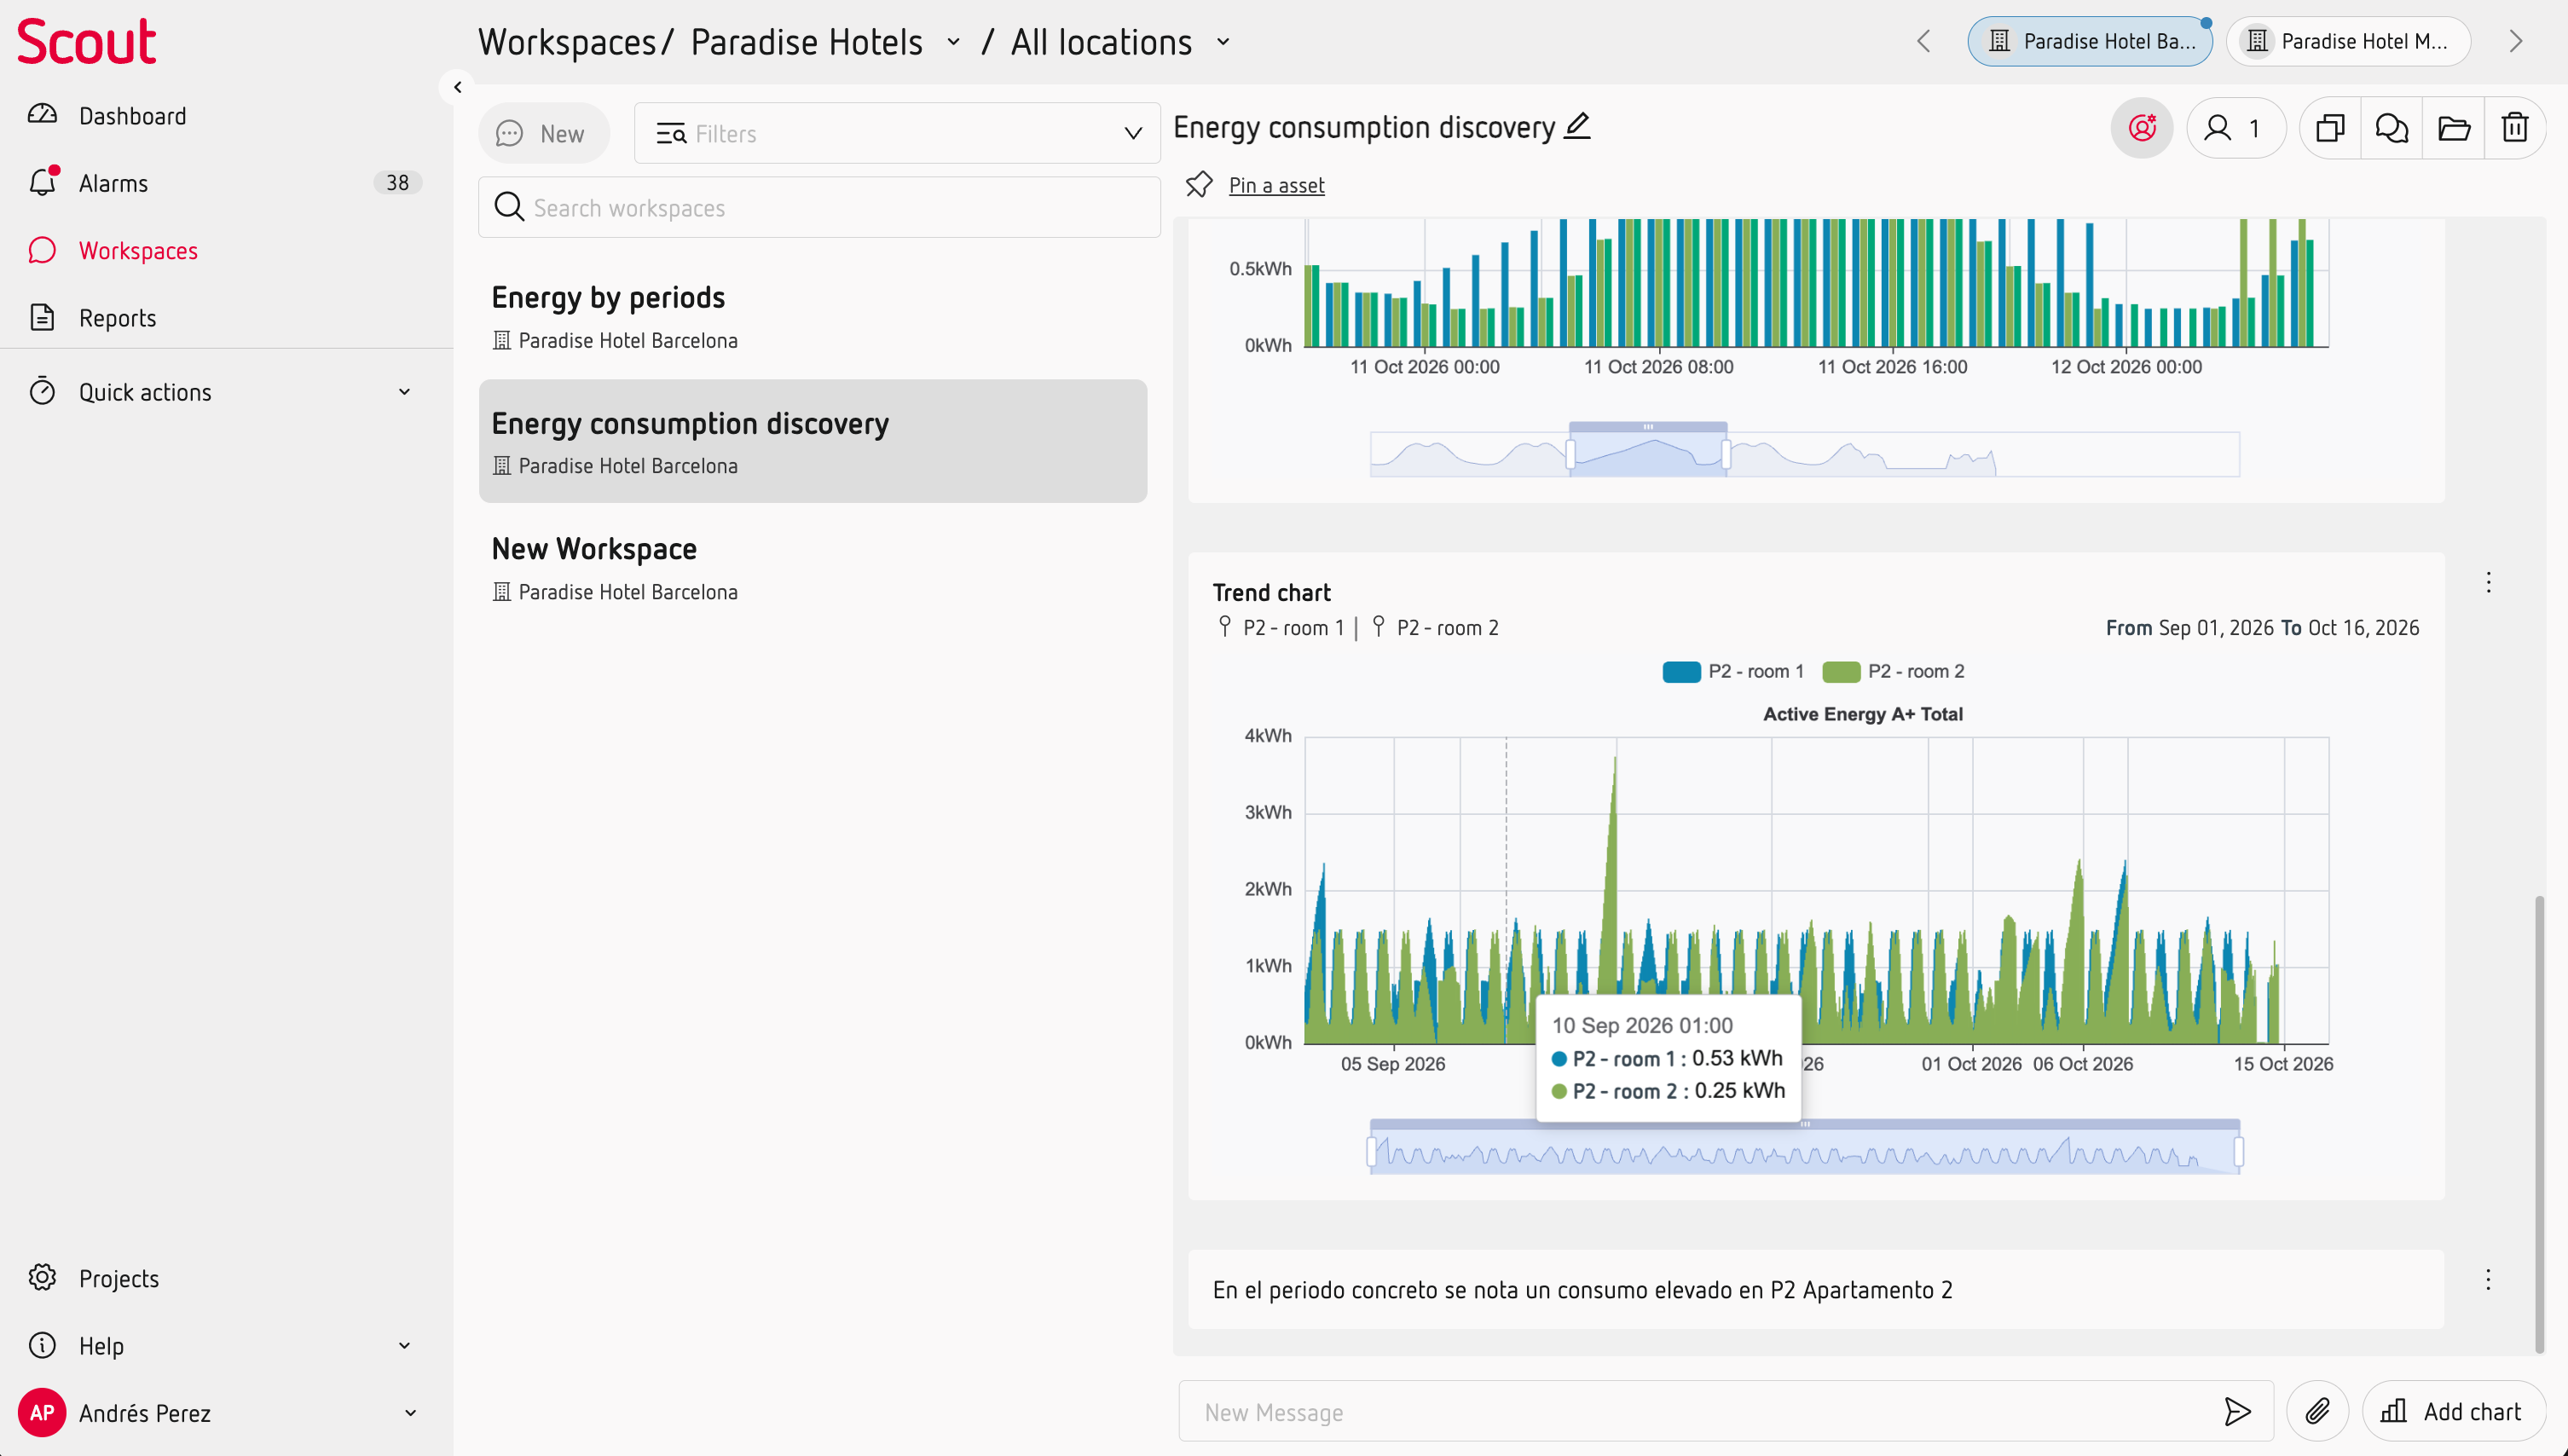
Investigate what you find
When a change or unusual behaviour needs more investigation, you can add other charts and measurements to the same Workspace, add notes or images, and document your findings.