Visualise your electrical measurements
Use Trend Charts to explore the electrical measurements available in Scout.
Scout brings measurements from your connected devices into one place, so you can quickly see the electrical information that matters to your installation.
See your measurements at a glance
Add a Trend Chart to Home to keep important electrical measurements visible and up to date.
You can choose the measurements you want to monitor and arrange the charts to create a dashboard that fits your installation.
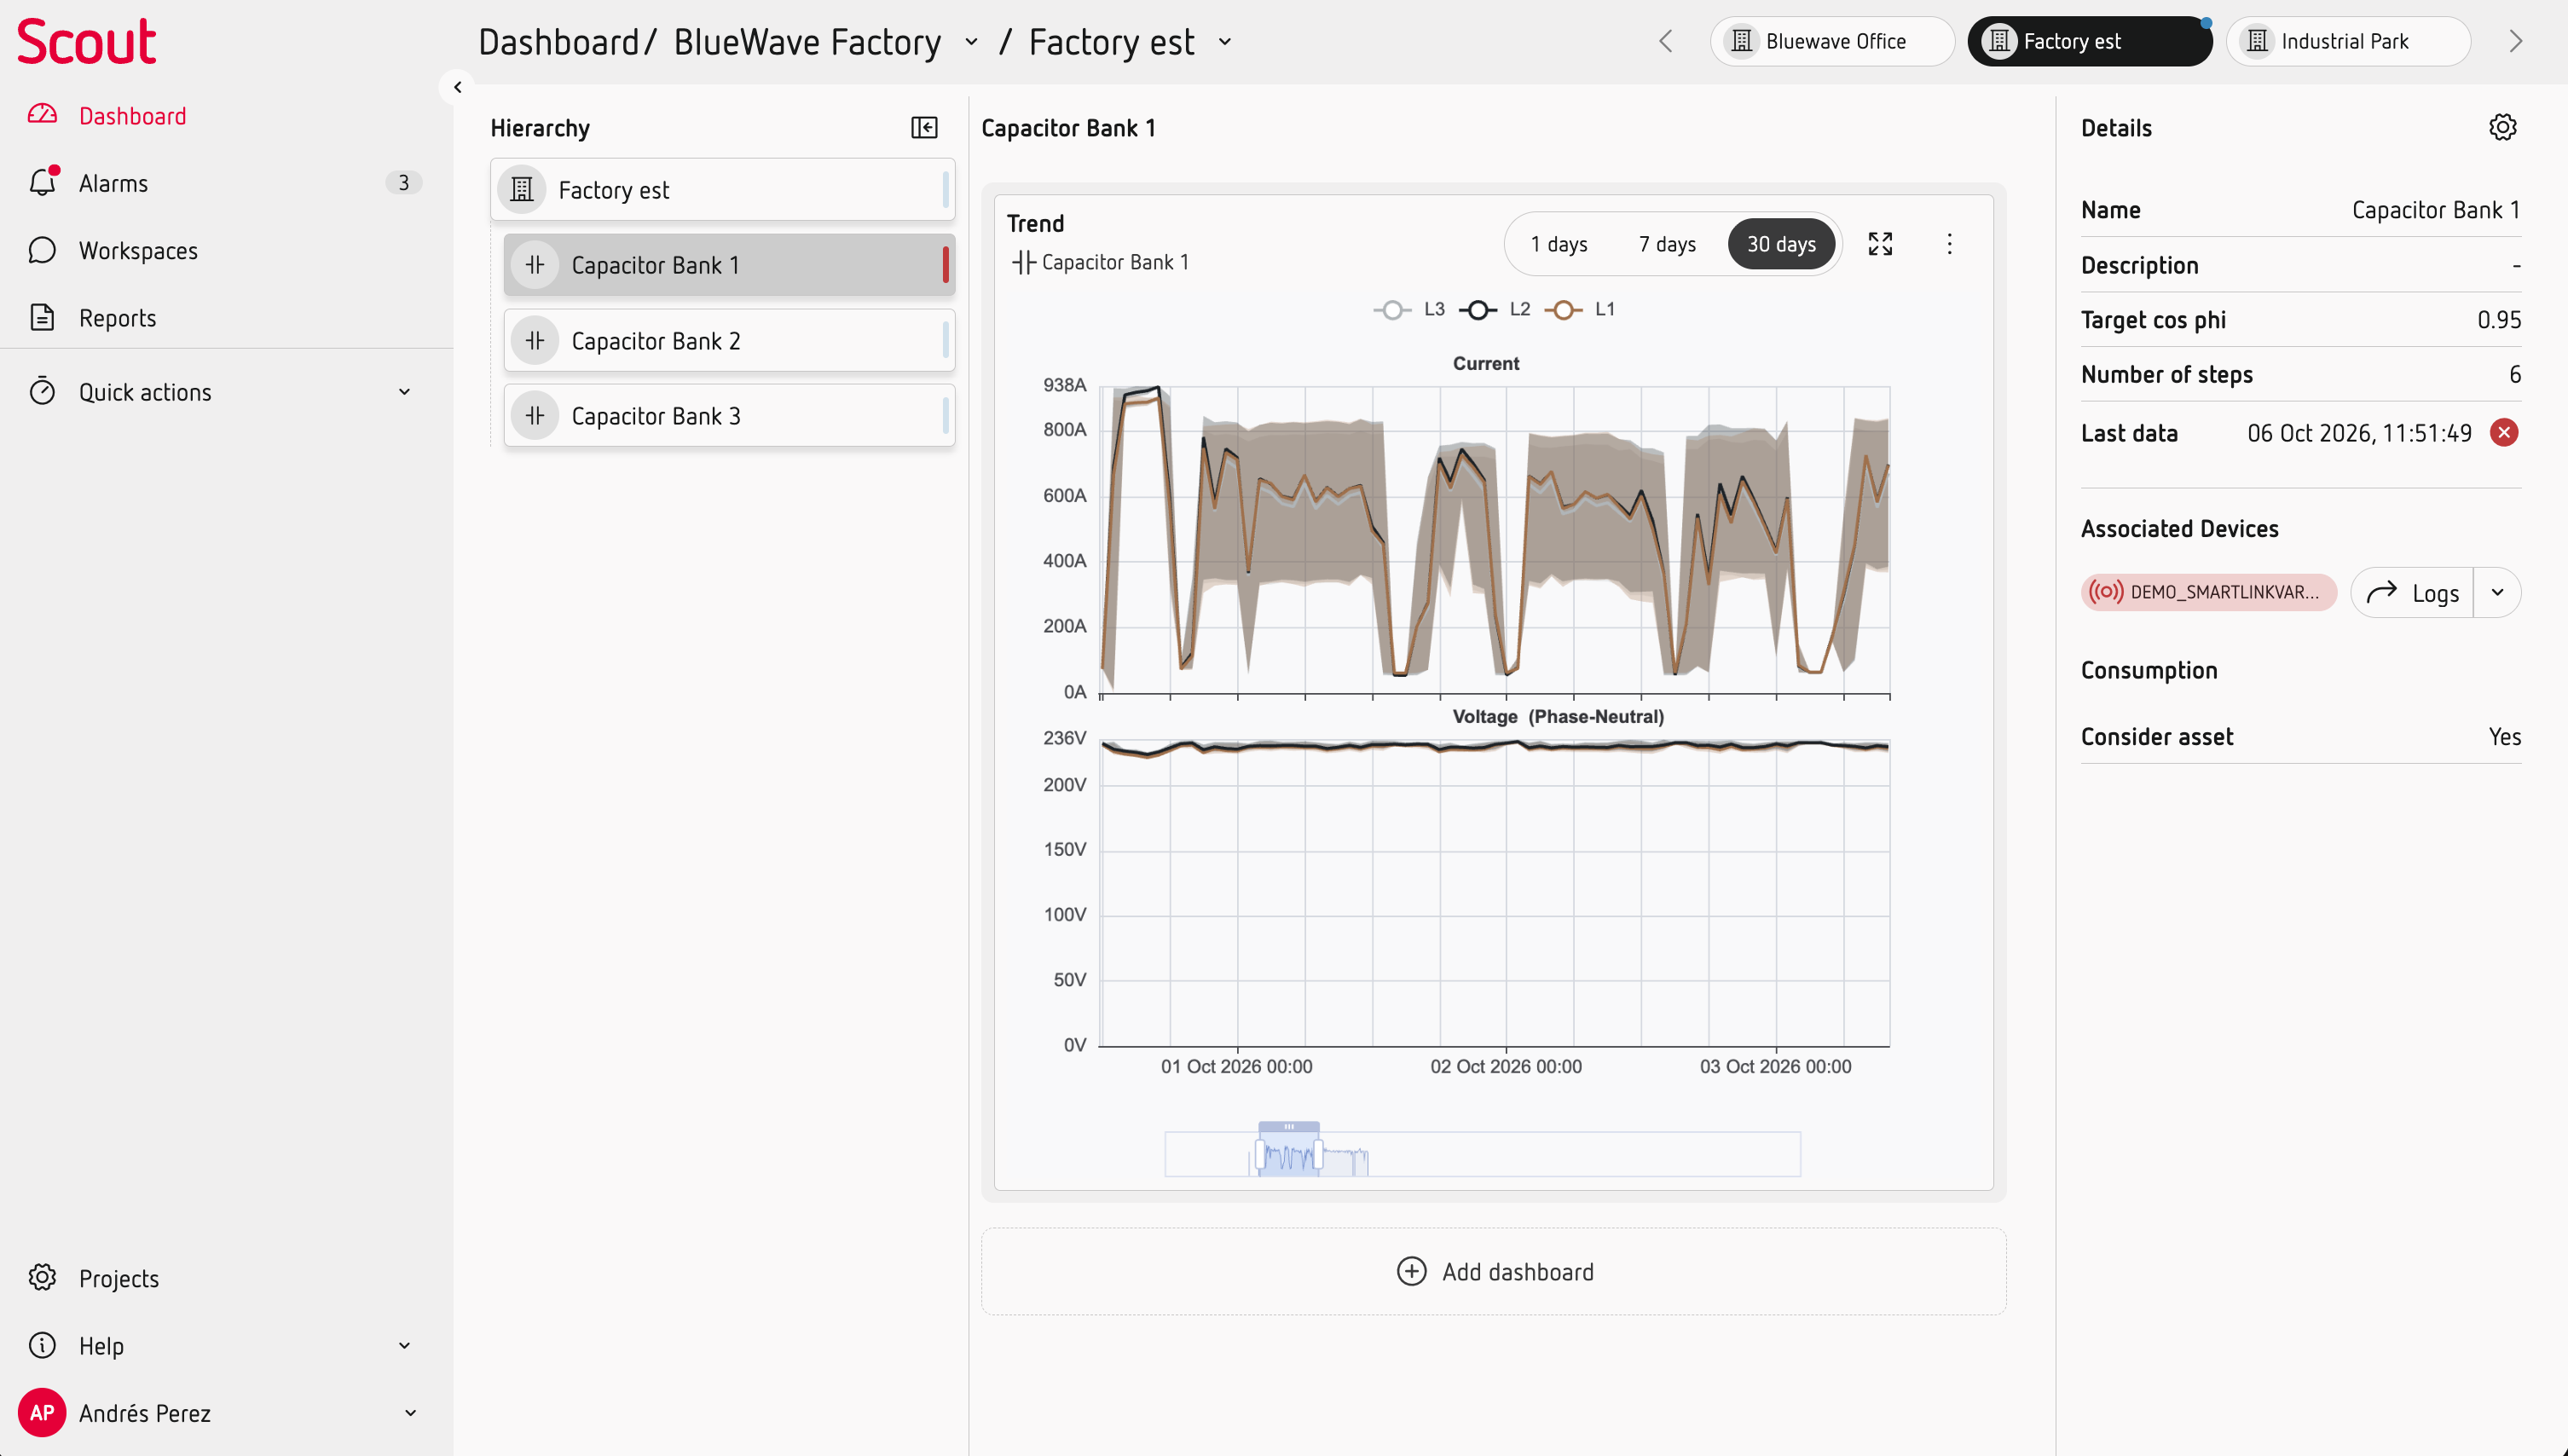
The data in Home is continuously updated as new measurements arrive, making it useful for keeping an eye on your installation.
Analyse a specific period
When you want to investigate what happened during a particular period, add a Trend Chart to a Workspace.
Select the period you want to analyse and choose the measurements that will help you understand what happened.
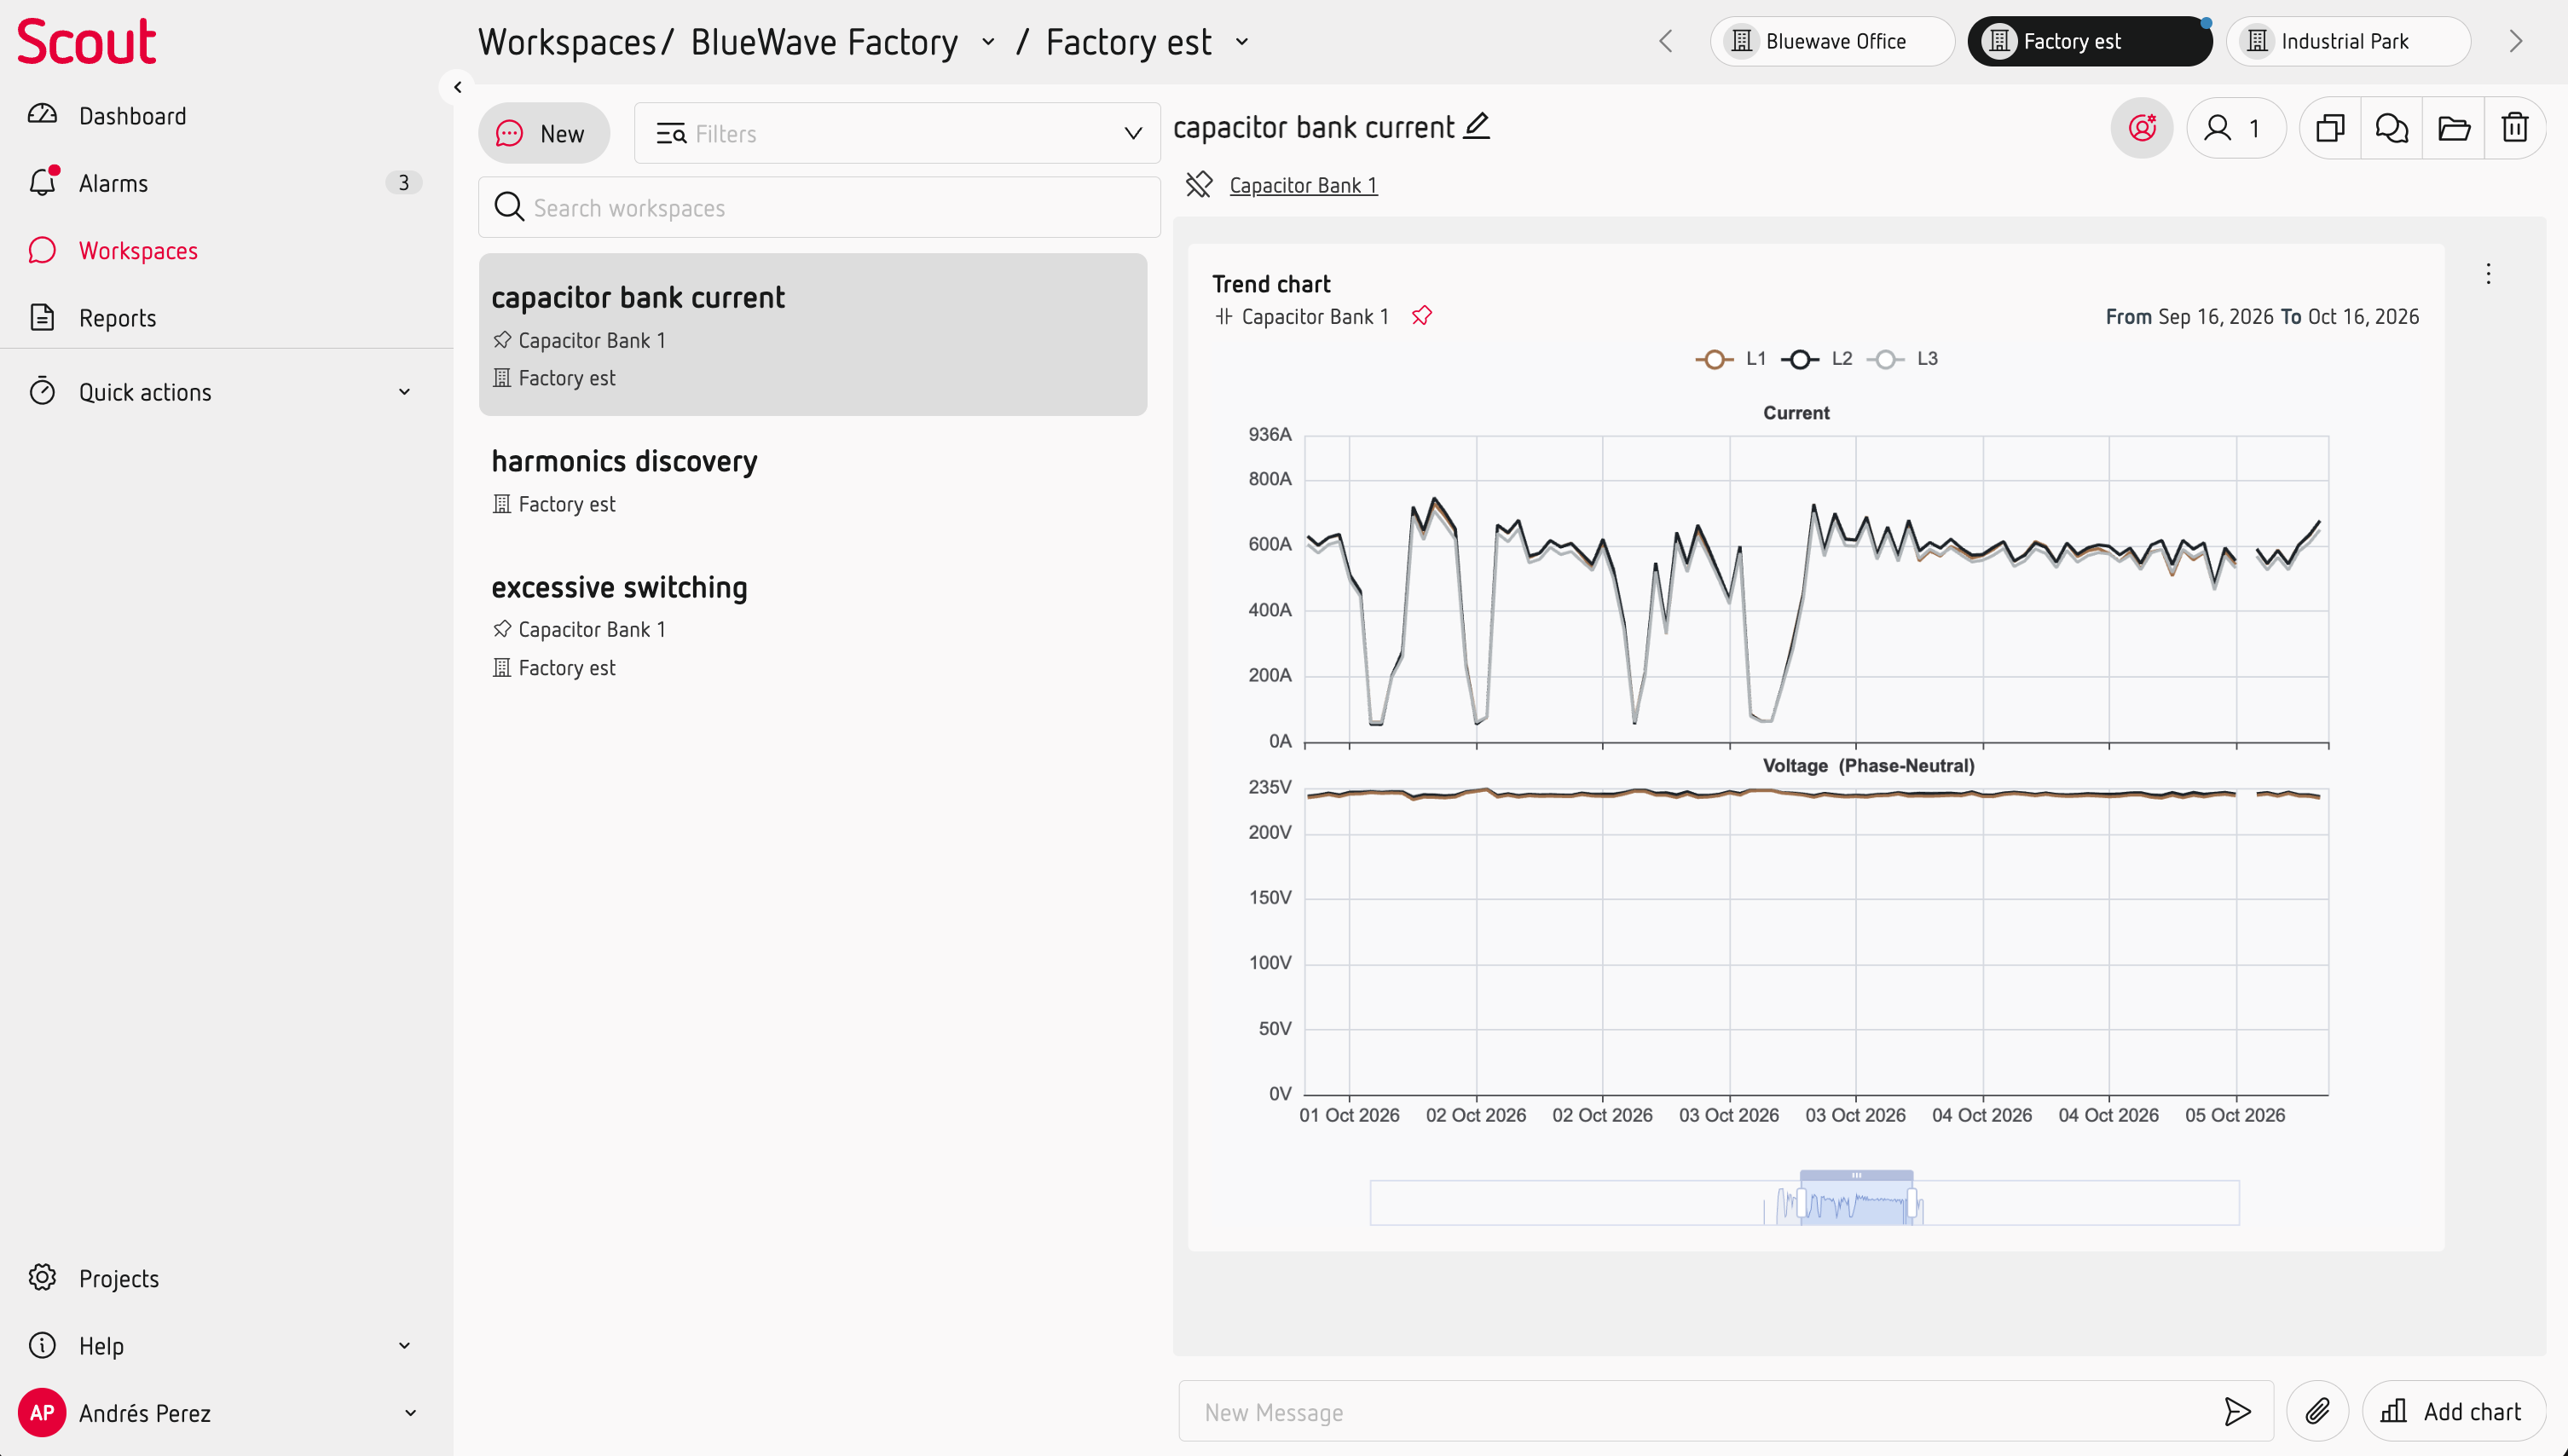
Unlike Home, the data in a Workspace represents the period you selected, so you can use it to investigate past events or document an analysis.
Compare different measurements
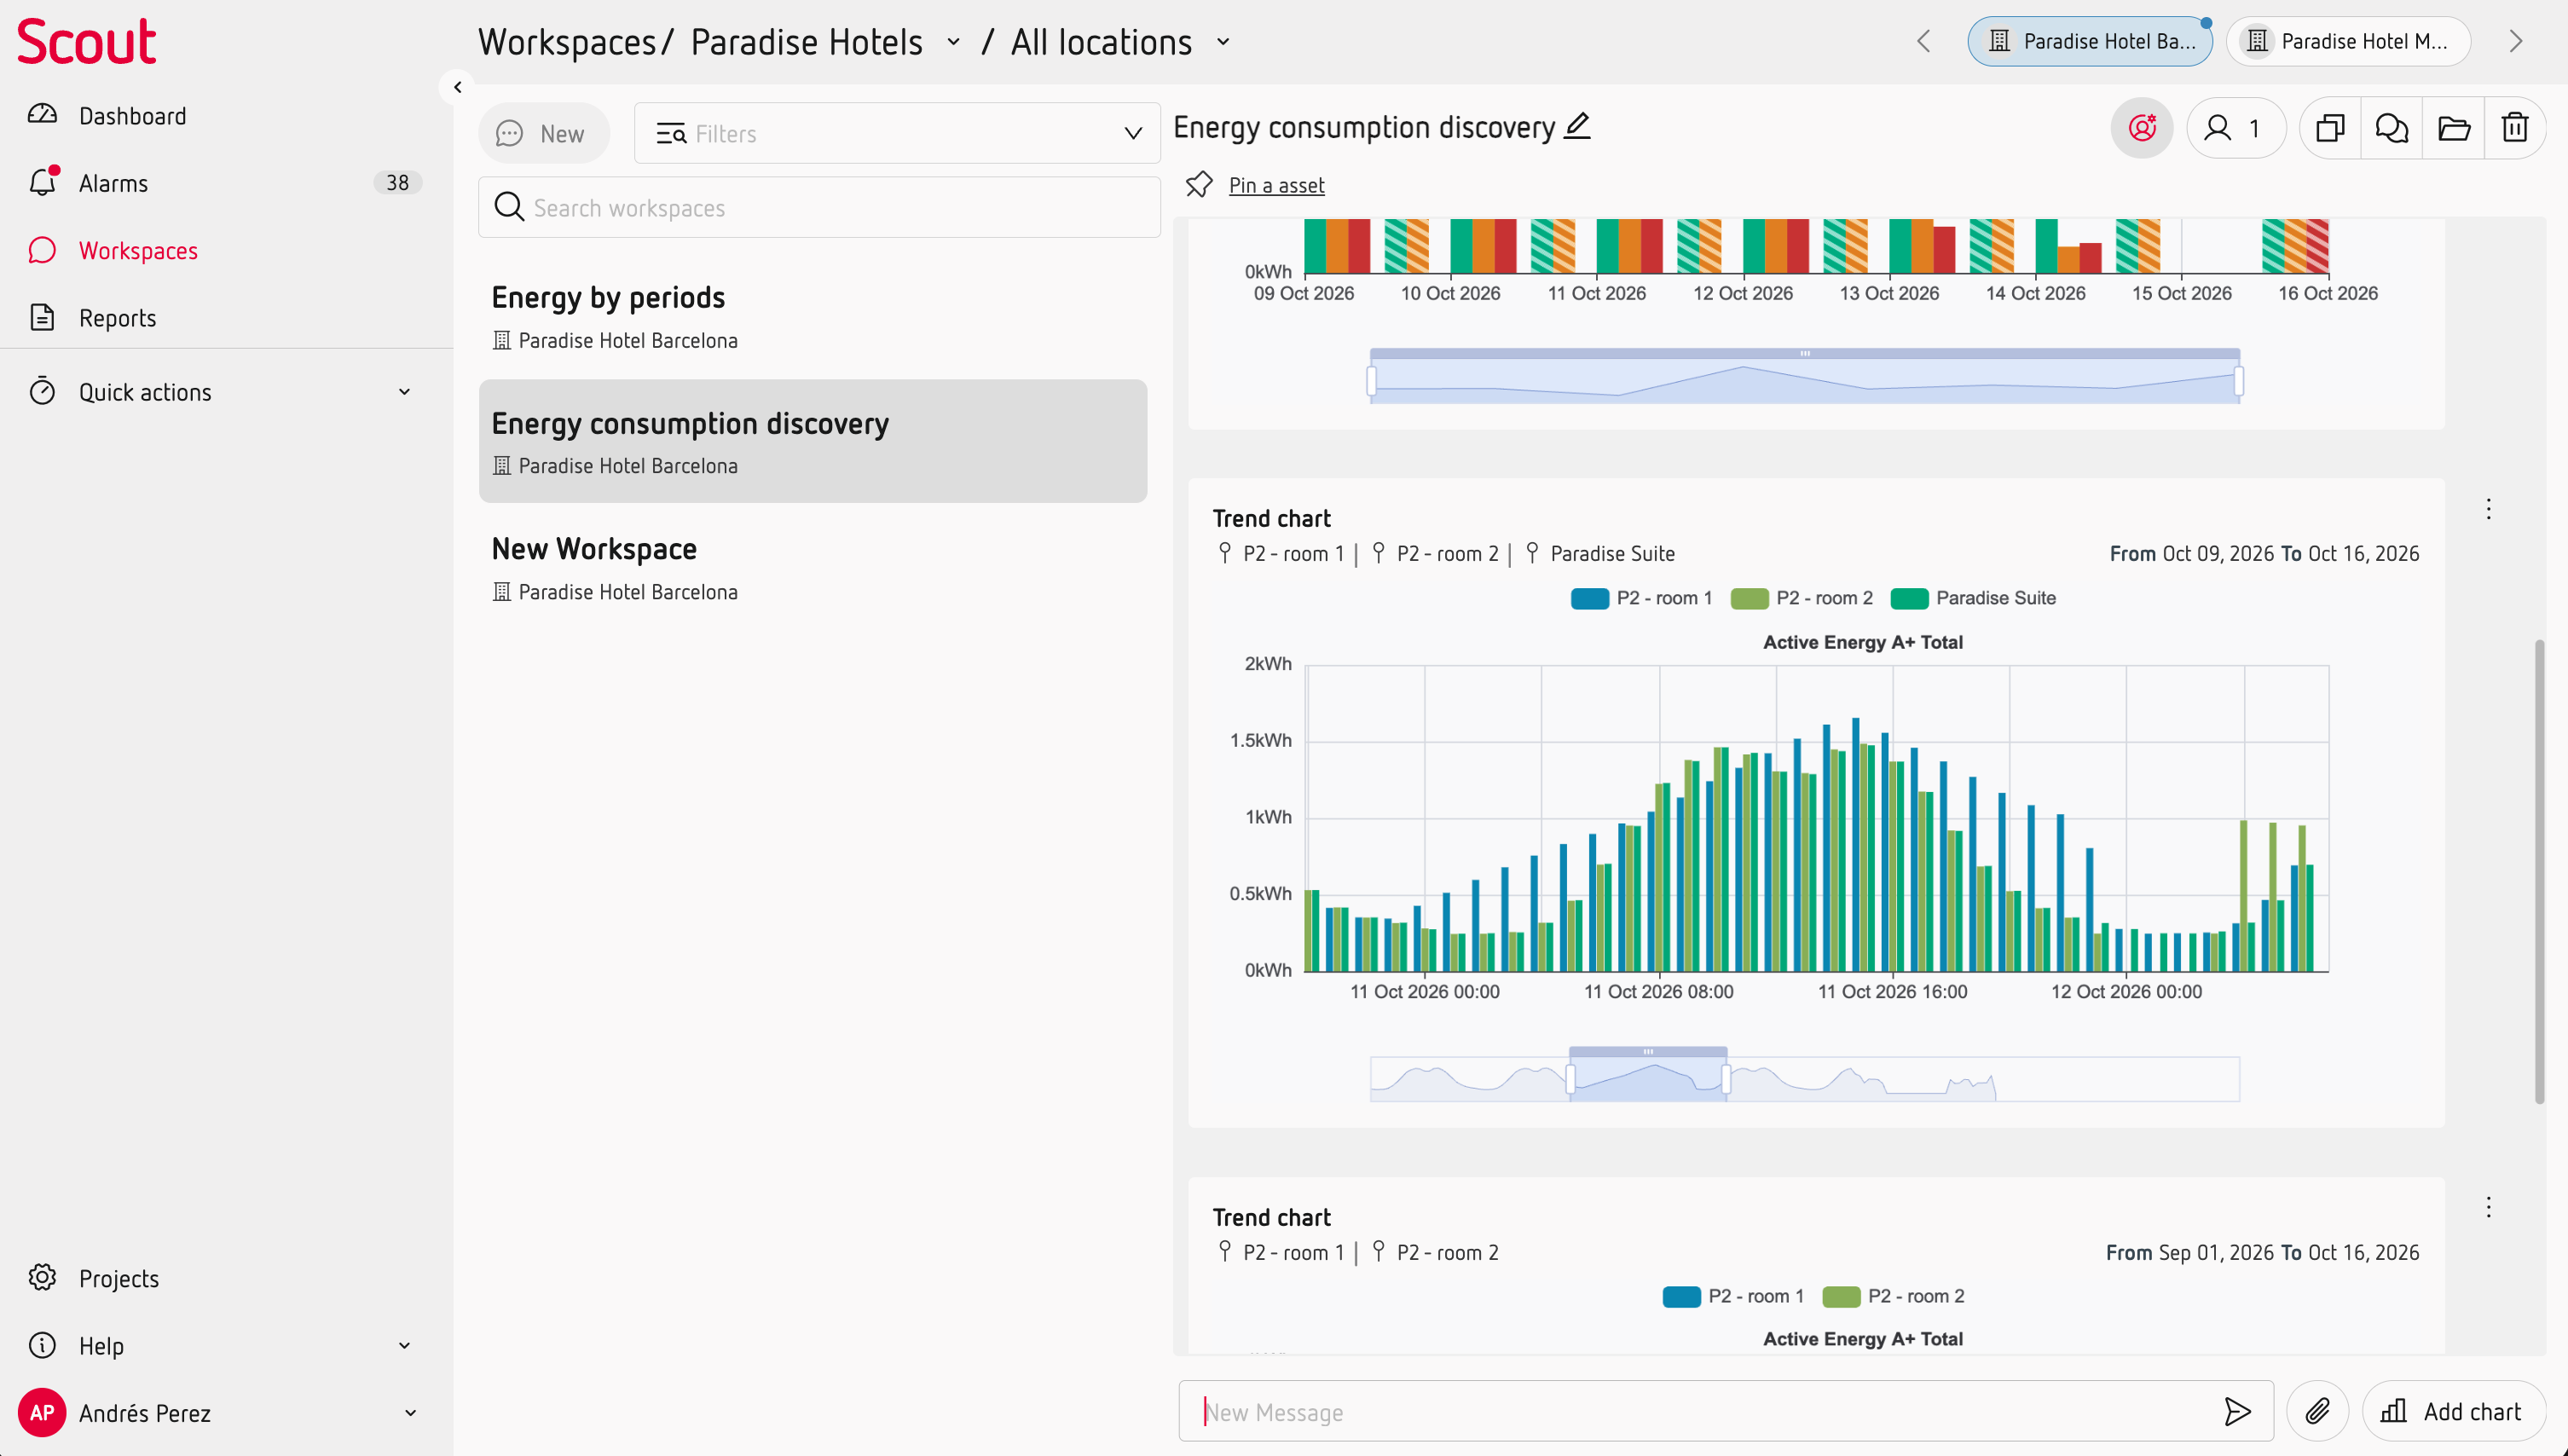
Use several Trend Charts together to compare measurements and understand how they relate to each other.
You can compare:
- Different measurements from the same Asset, such as voltage, current and power.
- The same measurement across different Assets, for example voltage or power consumption in different areas of your installation.
This can help you identify differences, similar behaviour or changes between different parts of your installation.
What you can do next
Once you have the measurements you need, you can go further: