Analyse your power factor and capacitor banks
Use VAR Charts to understand your power factor and check how your capacitor banks are performing.
A good power factor helps you avoid reactive energy penalties and ensures that your compensation system is working as expected.
Monitor your power factor
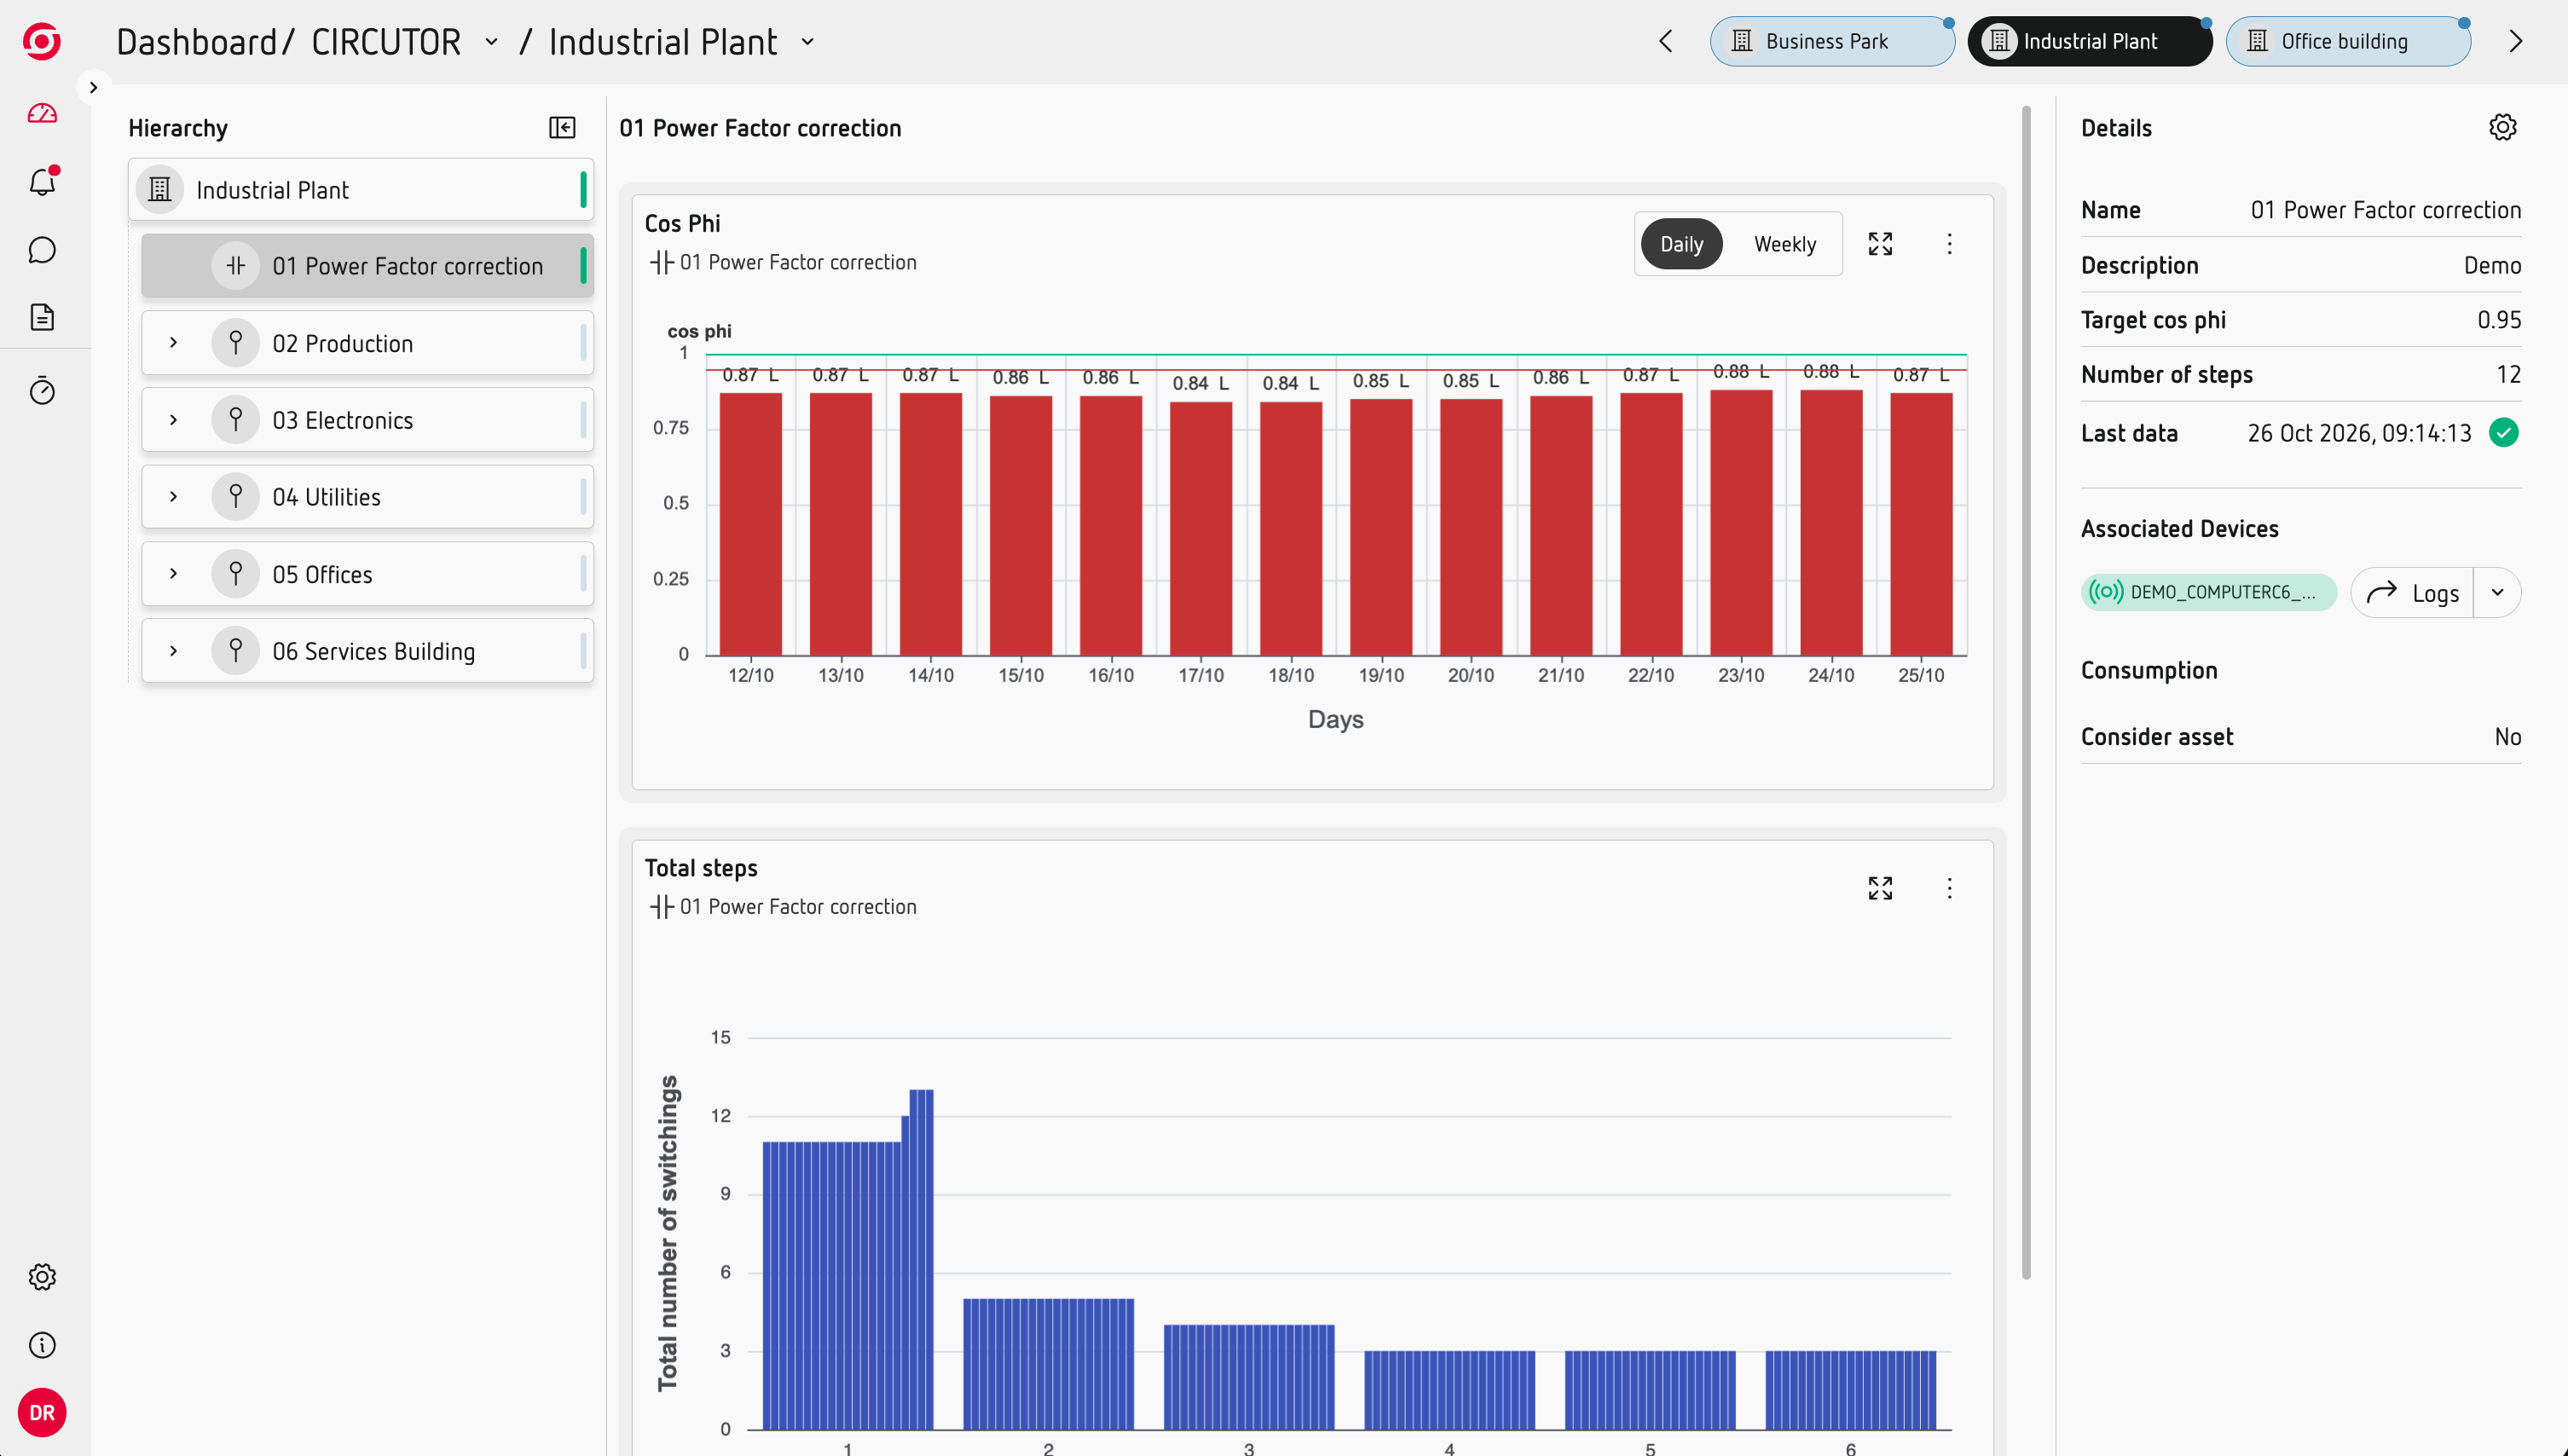
The Power Factor chart shows your cos φ over time, with daily and weekly views.
The chart makes it easy to see whether your power factor stays within the expected range and identify periods where it drops.
Use it to:
- Follow the evolution of your power factor.
- Identify periods with poor cos φ.
- Detect changes or sustained deterioration.
- Focus your analysis on periods that need attention.
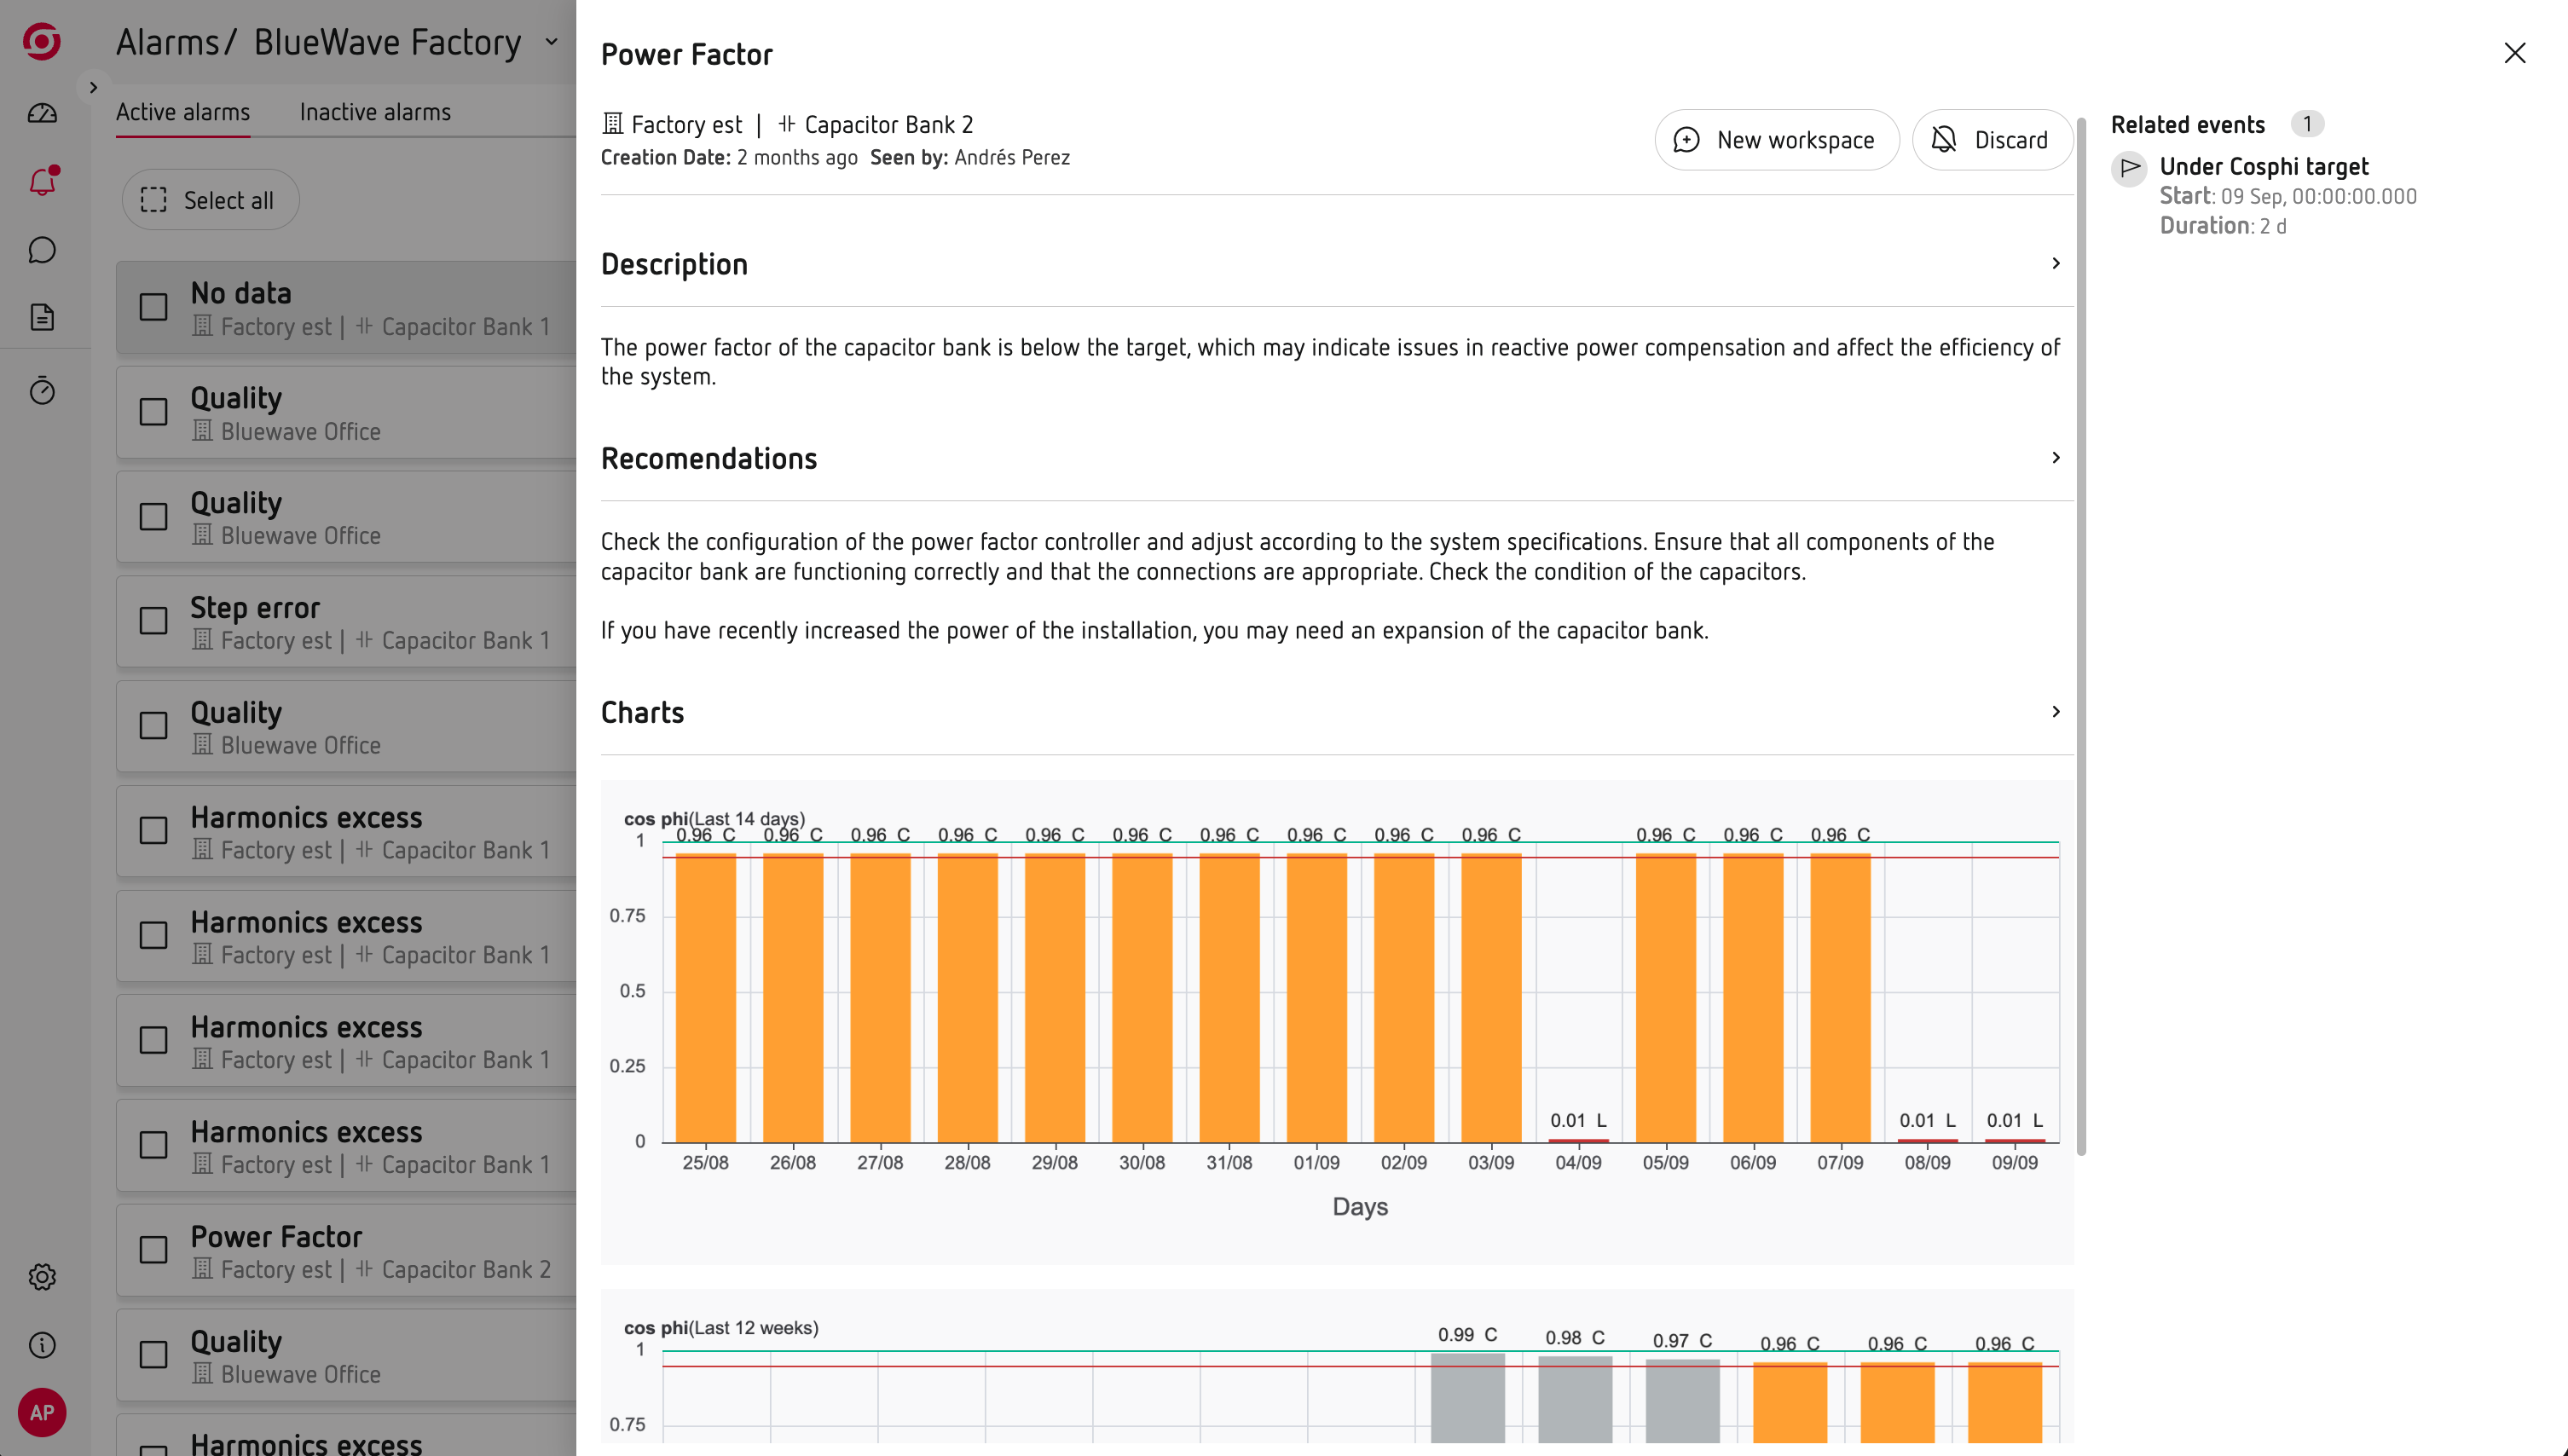
Scout can generate an alert when cos φ falls below the configured threshold or when it detects a sustained downward trend.
Check your capacitor bank performance
Scout also provides information about the behaviour of your capacitor banks.
The Switching Operations chart shows the number of switching operations over time.
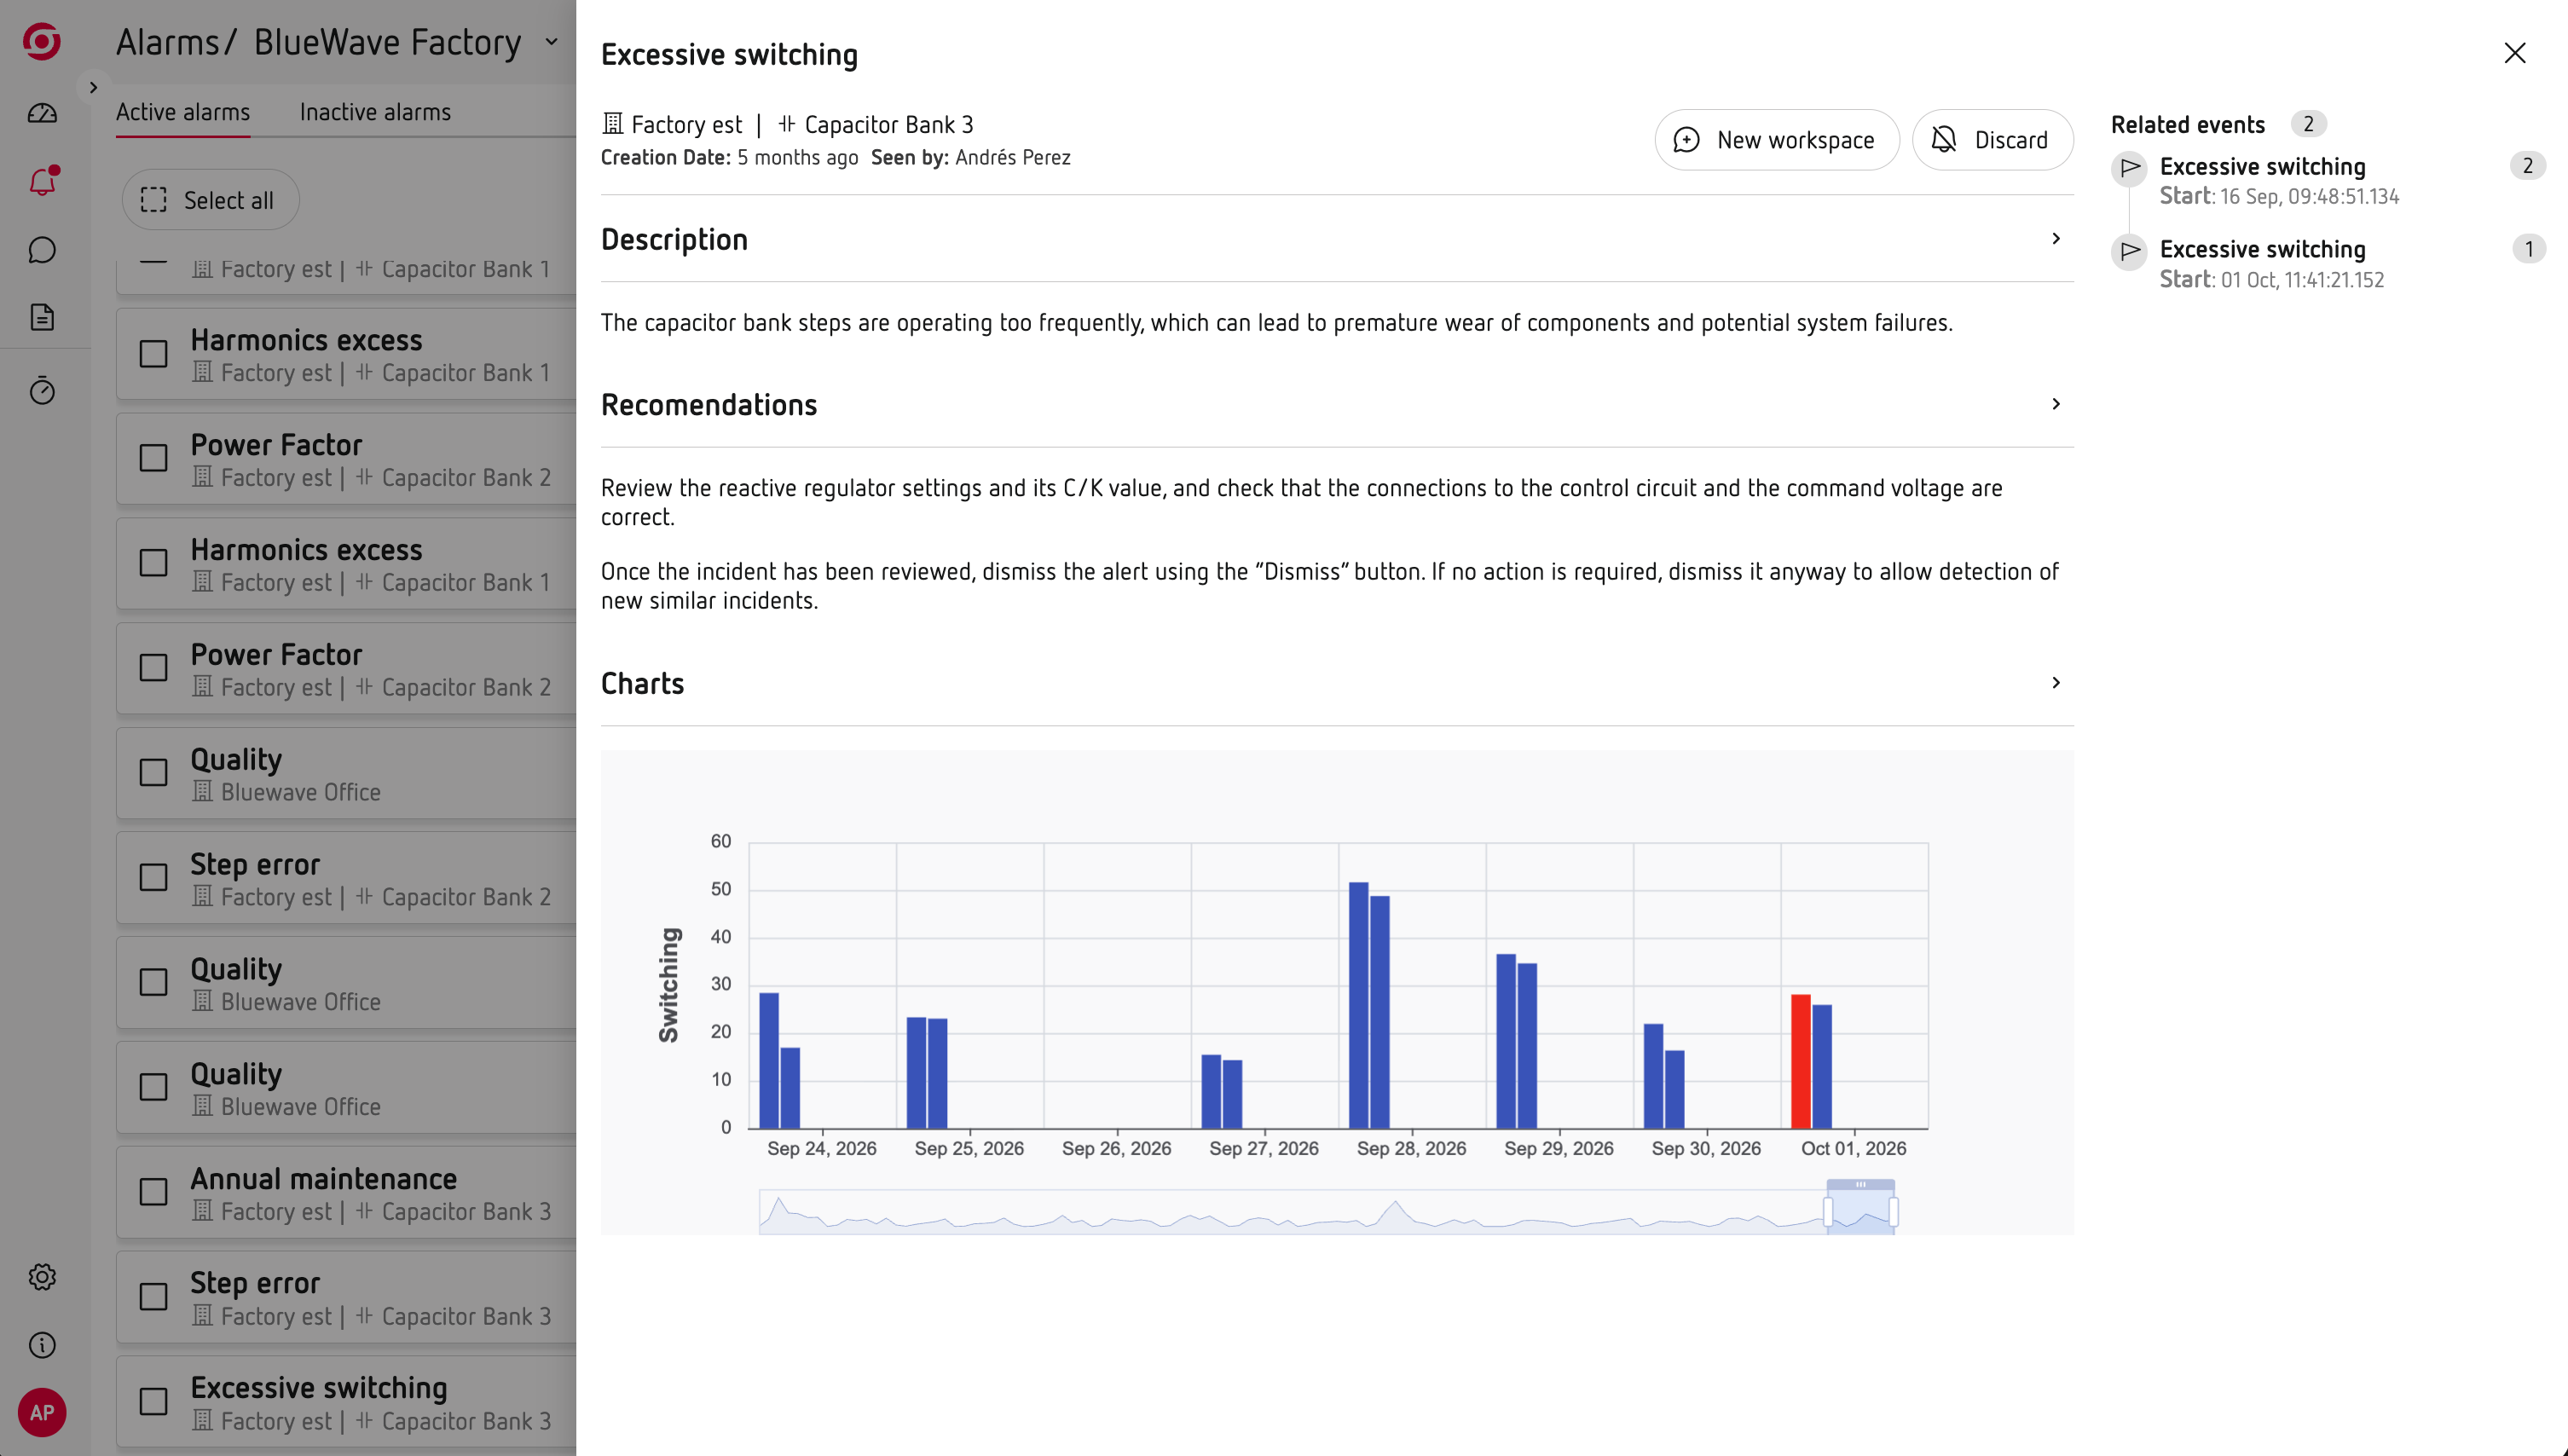
This can help you identify unusual behaviour, such as an excessive number of operations that may indicate a problem with the compensation system.
Scout can also detect:
- Defective compensation
- Excessive switching operations
- Maintenance conditions
These conditions can generate alerts so you can investigate them before they lead to further problems.
Investigate when something changes
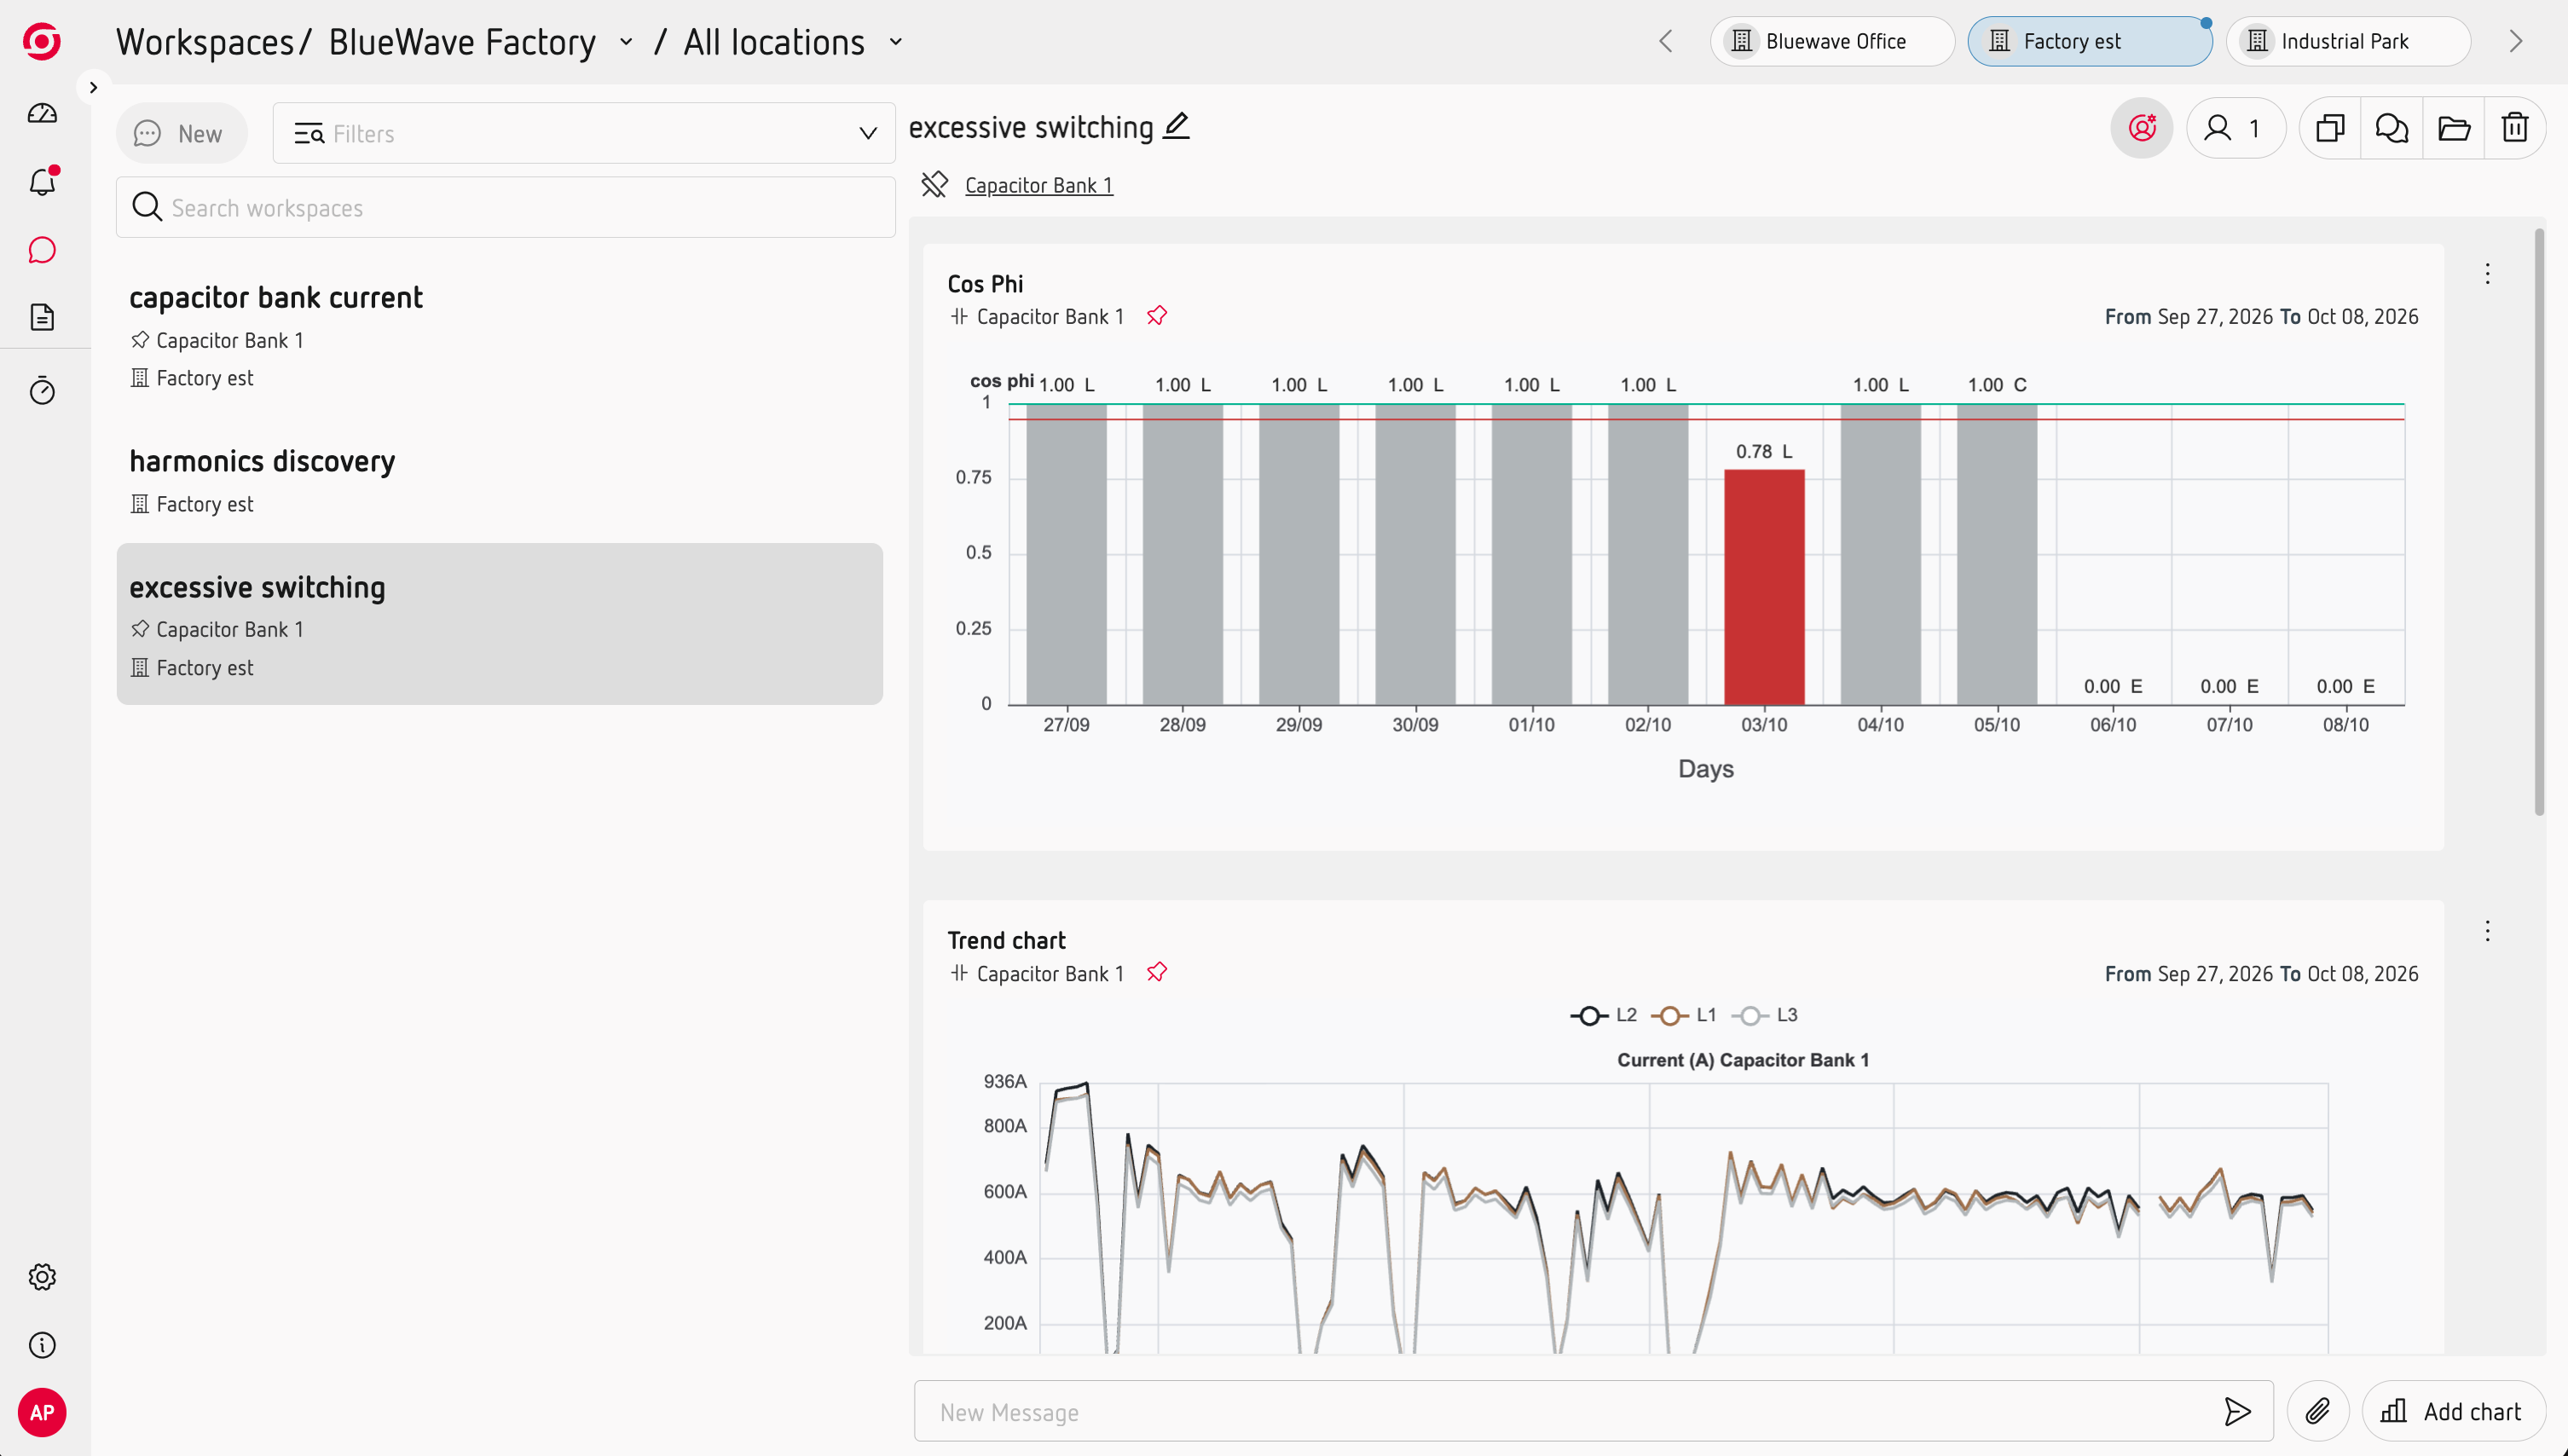
When you identify a problem or unusual behaviour, use a Workspace to investigate the relevant period in more detail.
You can combine the VAR charts with other electrical measurements and add notes or images to document your findings.