Analyse consumption over time
Use Consumption Charts to explore trends and compare different periods.
Looking at your total consumption is useful. Seeing how it changes over time can help you understand what is happening in your installation.
Use Scout's Consumption chart to explore consumption over different periods and identify changes, trends or unusual behaviour.
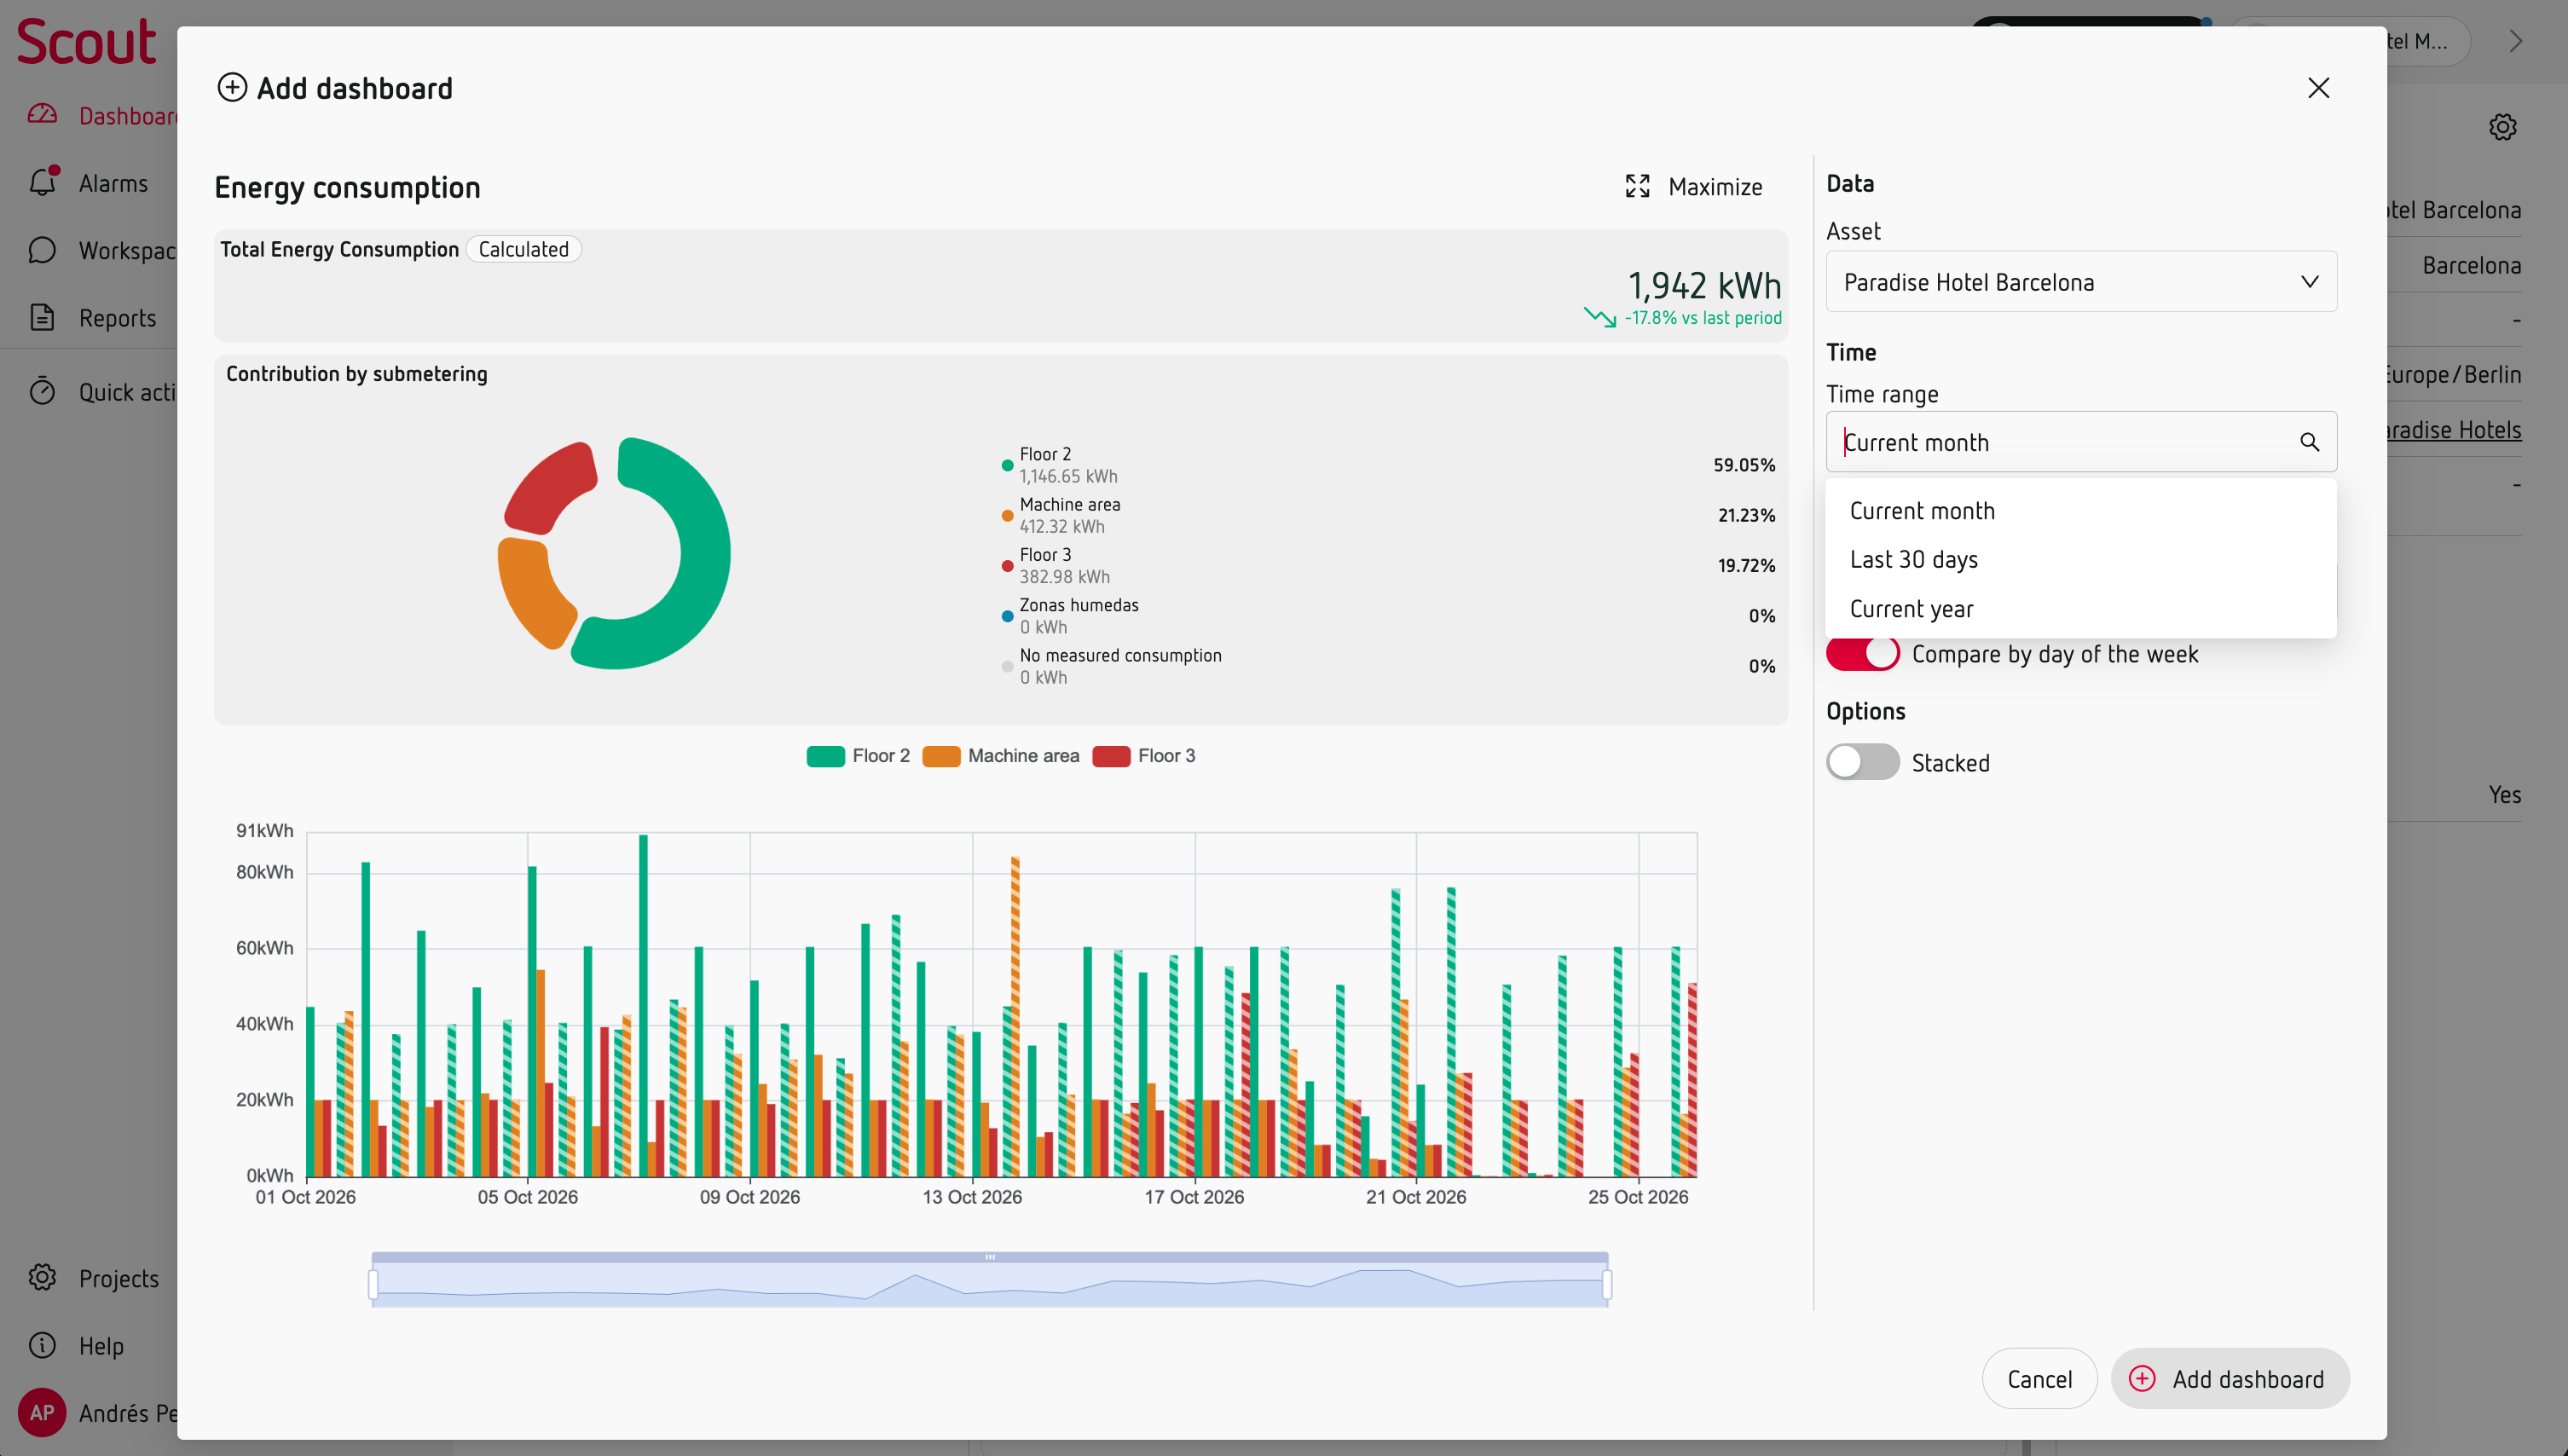
Choose the period that fits your analysis
You can view consumption at different levels of detail:
- Current month – daily consumption.
- Last 30 days – daily consumption.
- Last year – monthly consumption.
Compare your consumption
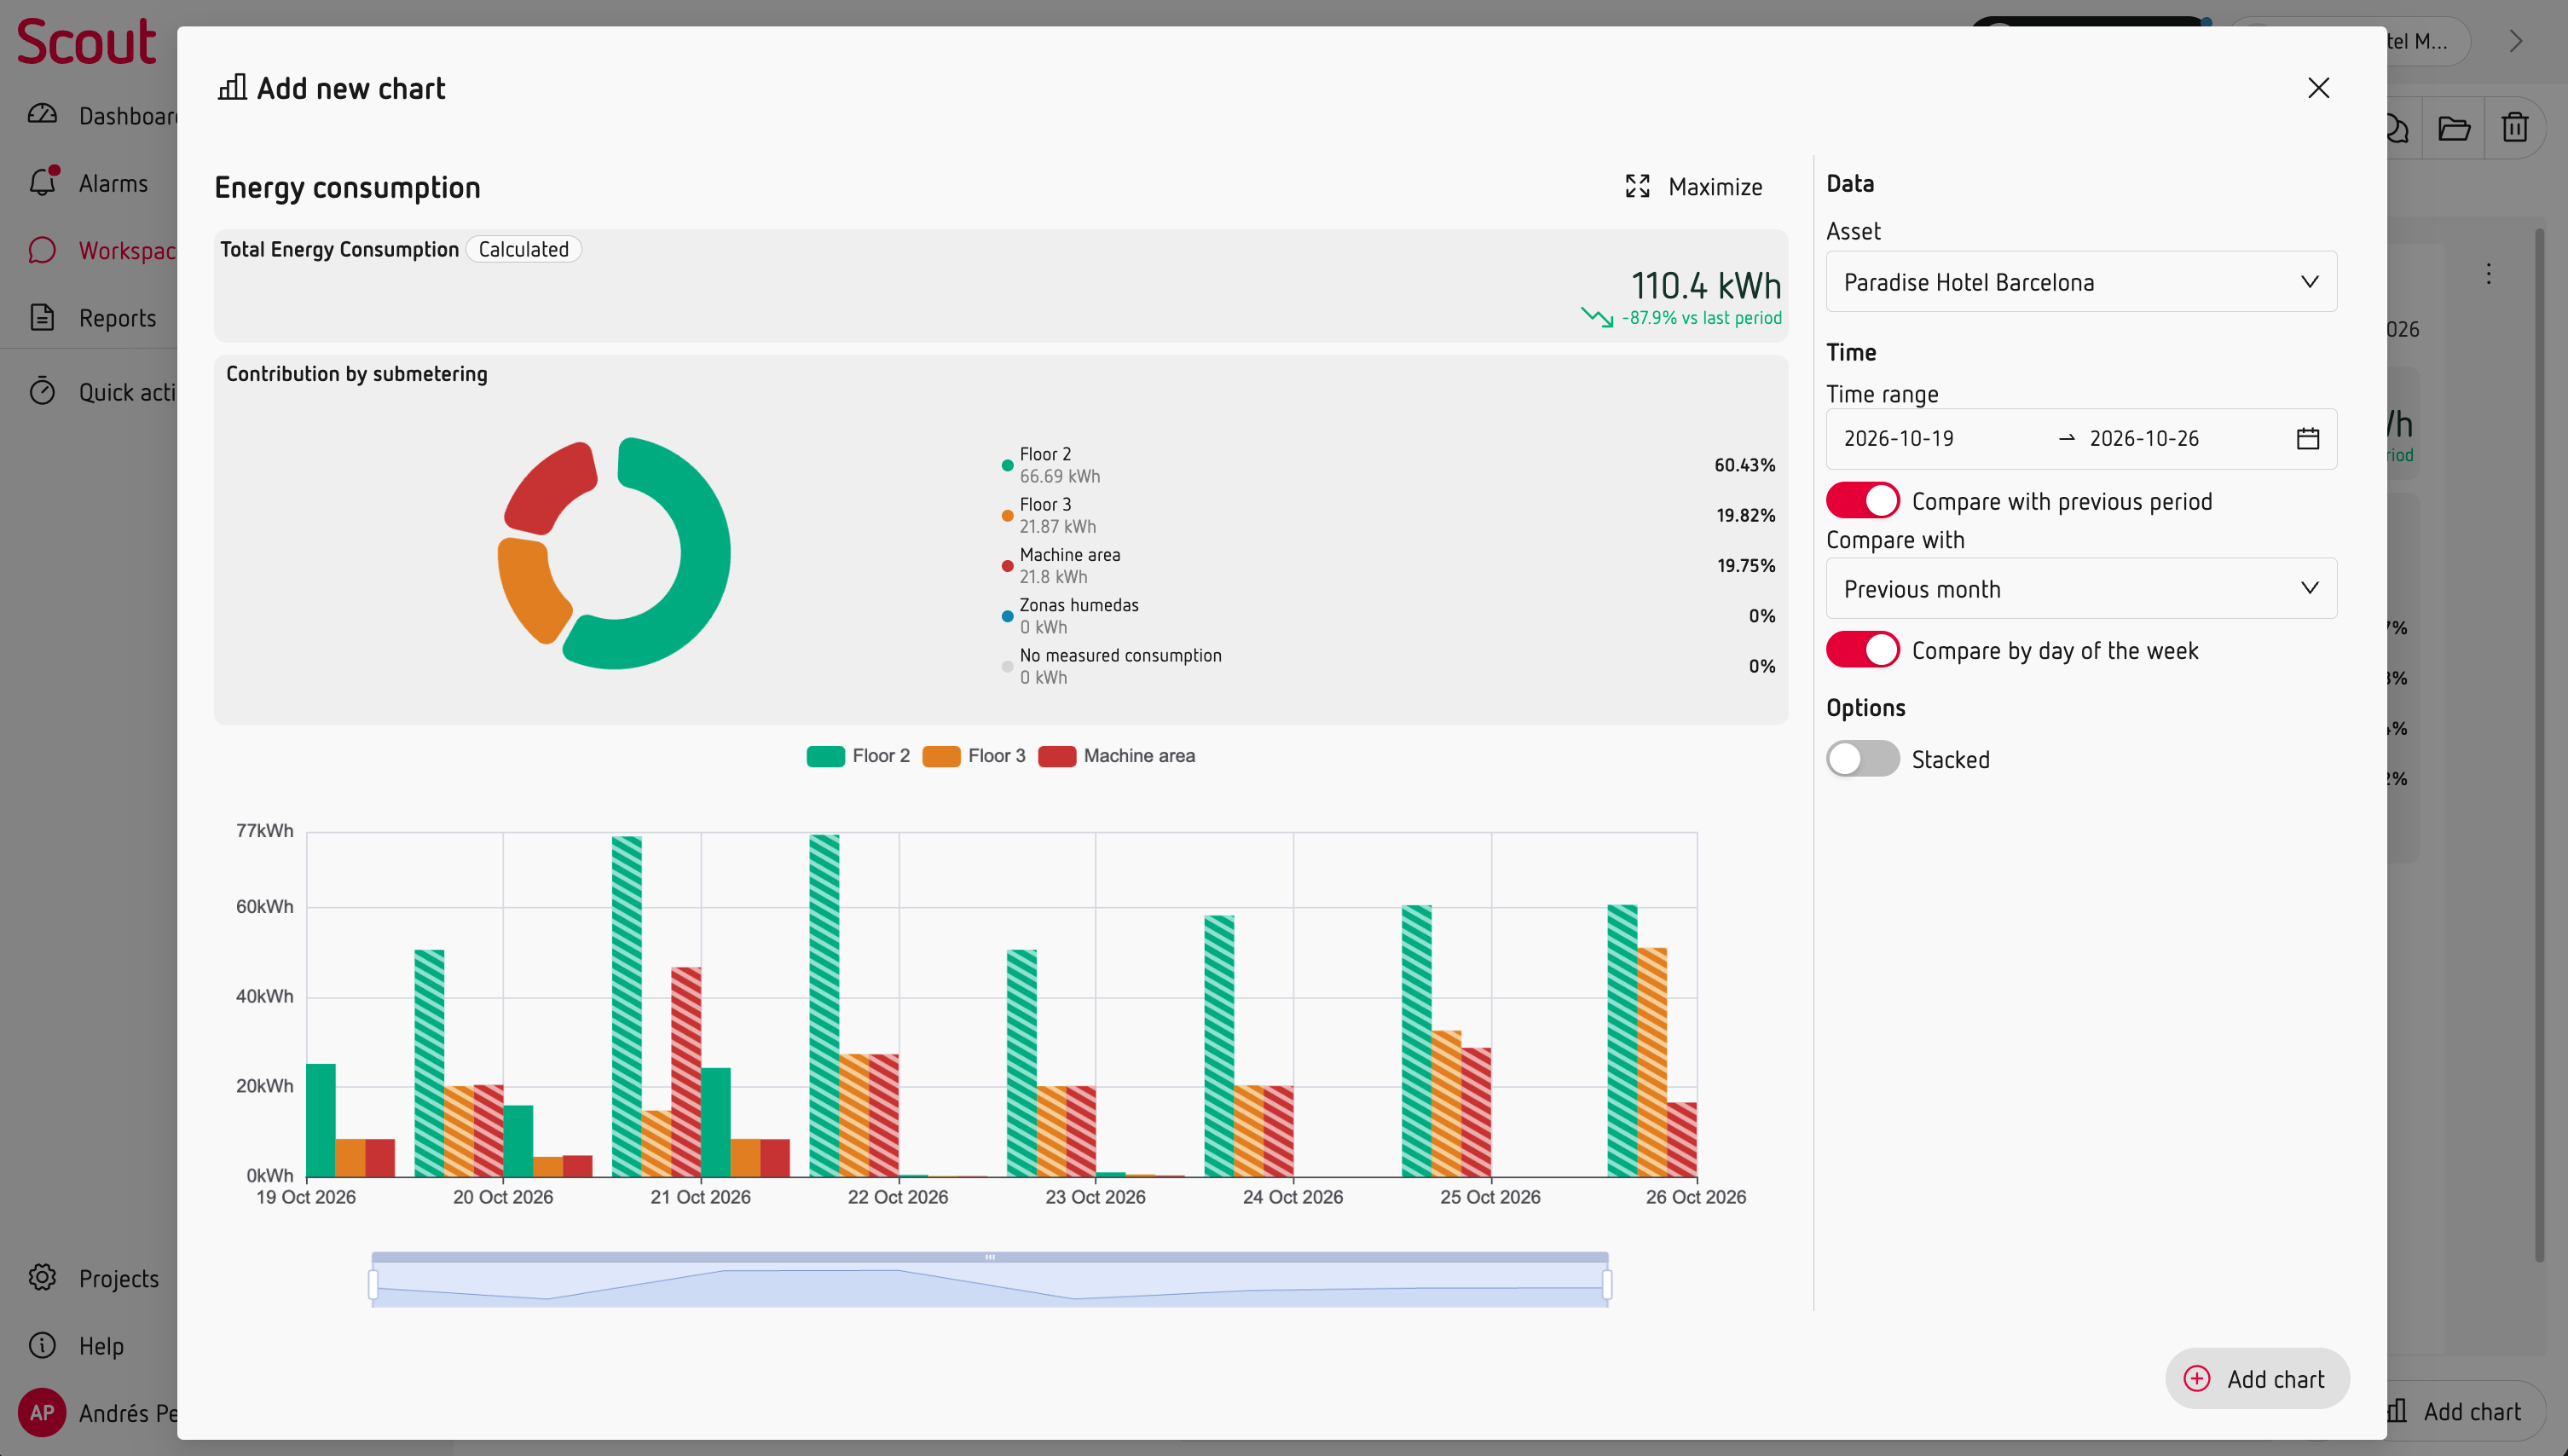
Scout lets you compare the selected period with:
- Previous period – to see how consumption has changed recently.
- Same period last year (YoY) – to compare with the equivalent period from the previous year.
This can help you identify changes in consumption patterns and understand whether an increase or decrease is temporary or part of a longer-term trend.
Investigate a specific period
When you need to look beyond the most recent data, use a Workspace.
Select the period you want to investigate and add the consumption charts and other measurements that can help you understand what happened.
You can also add notes and observations to document your analysis or prepare a pre-report.
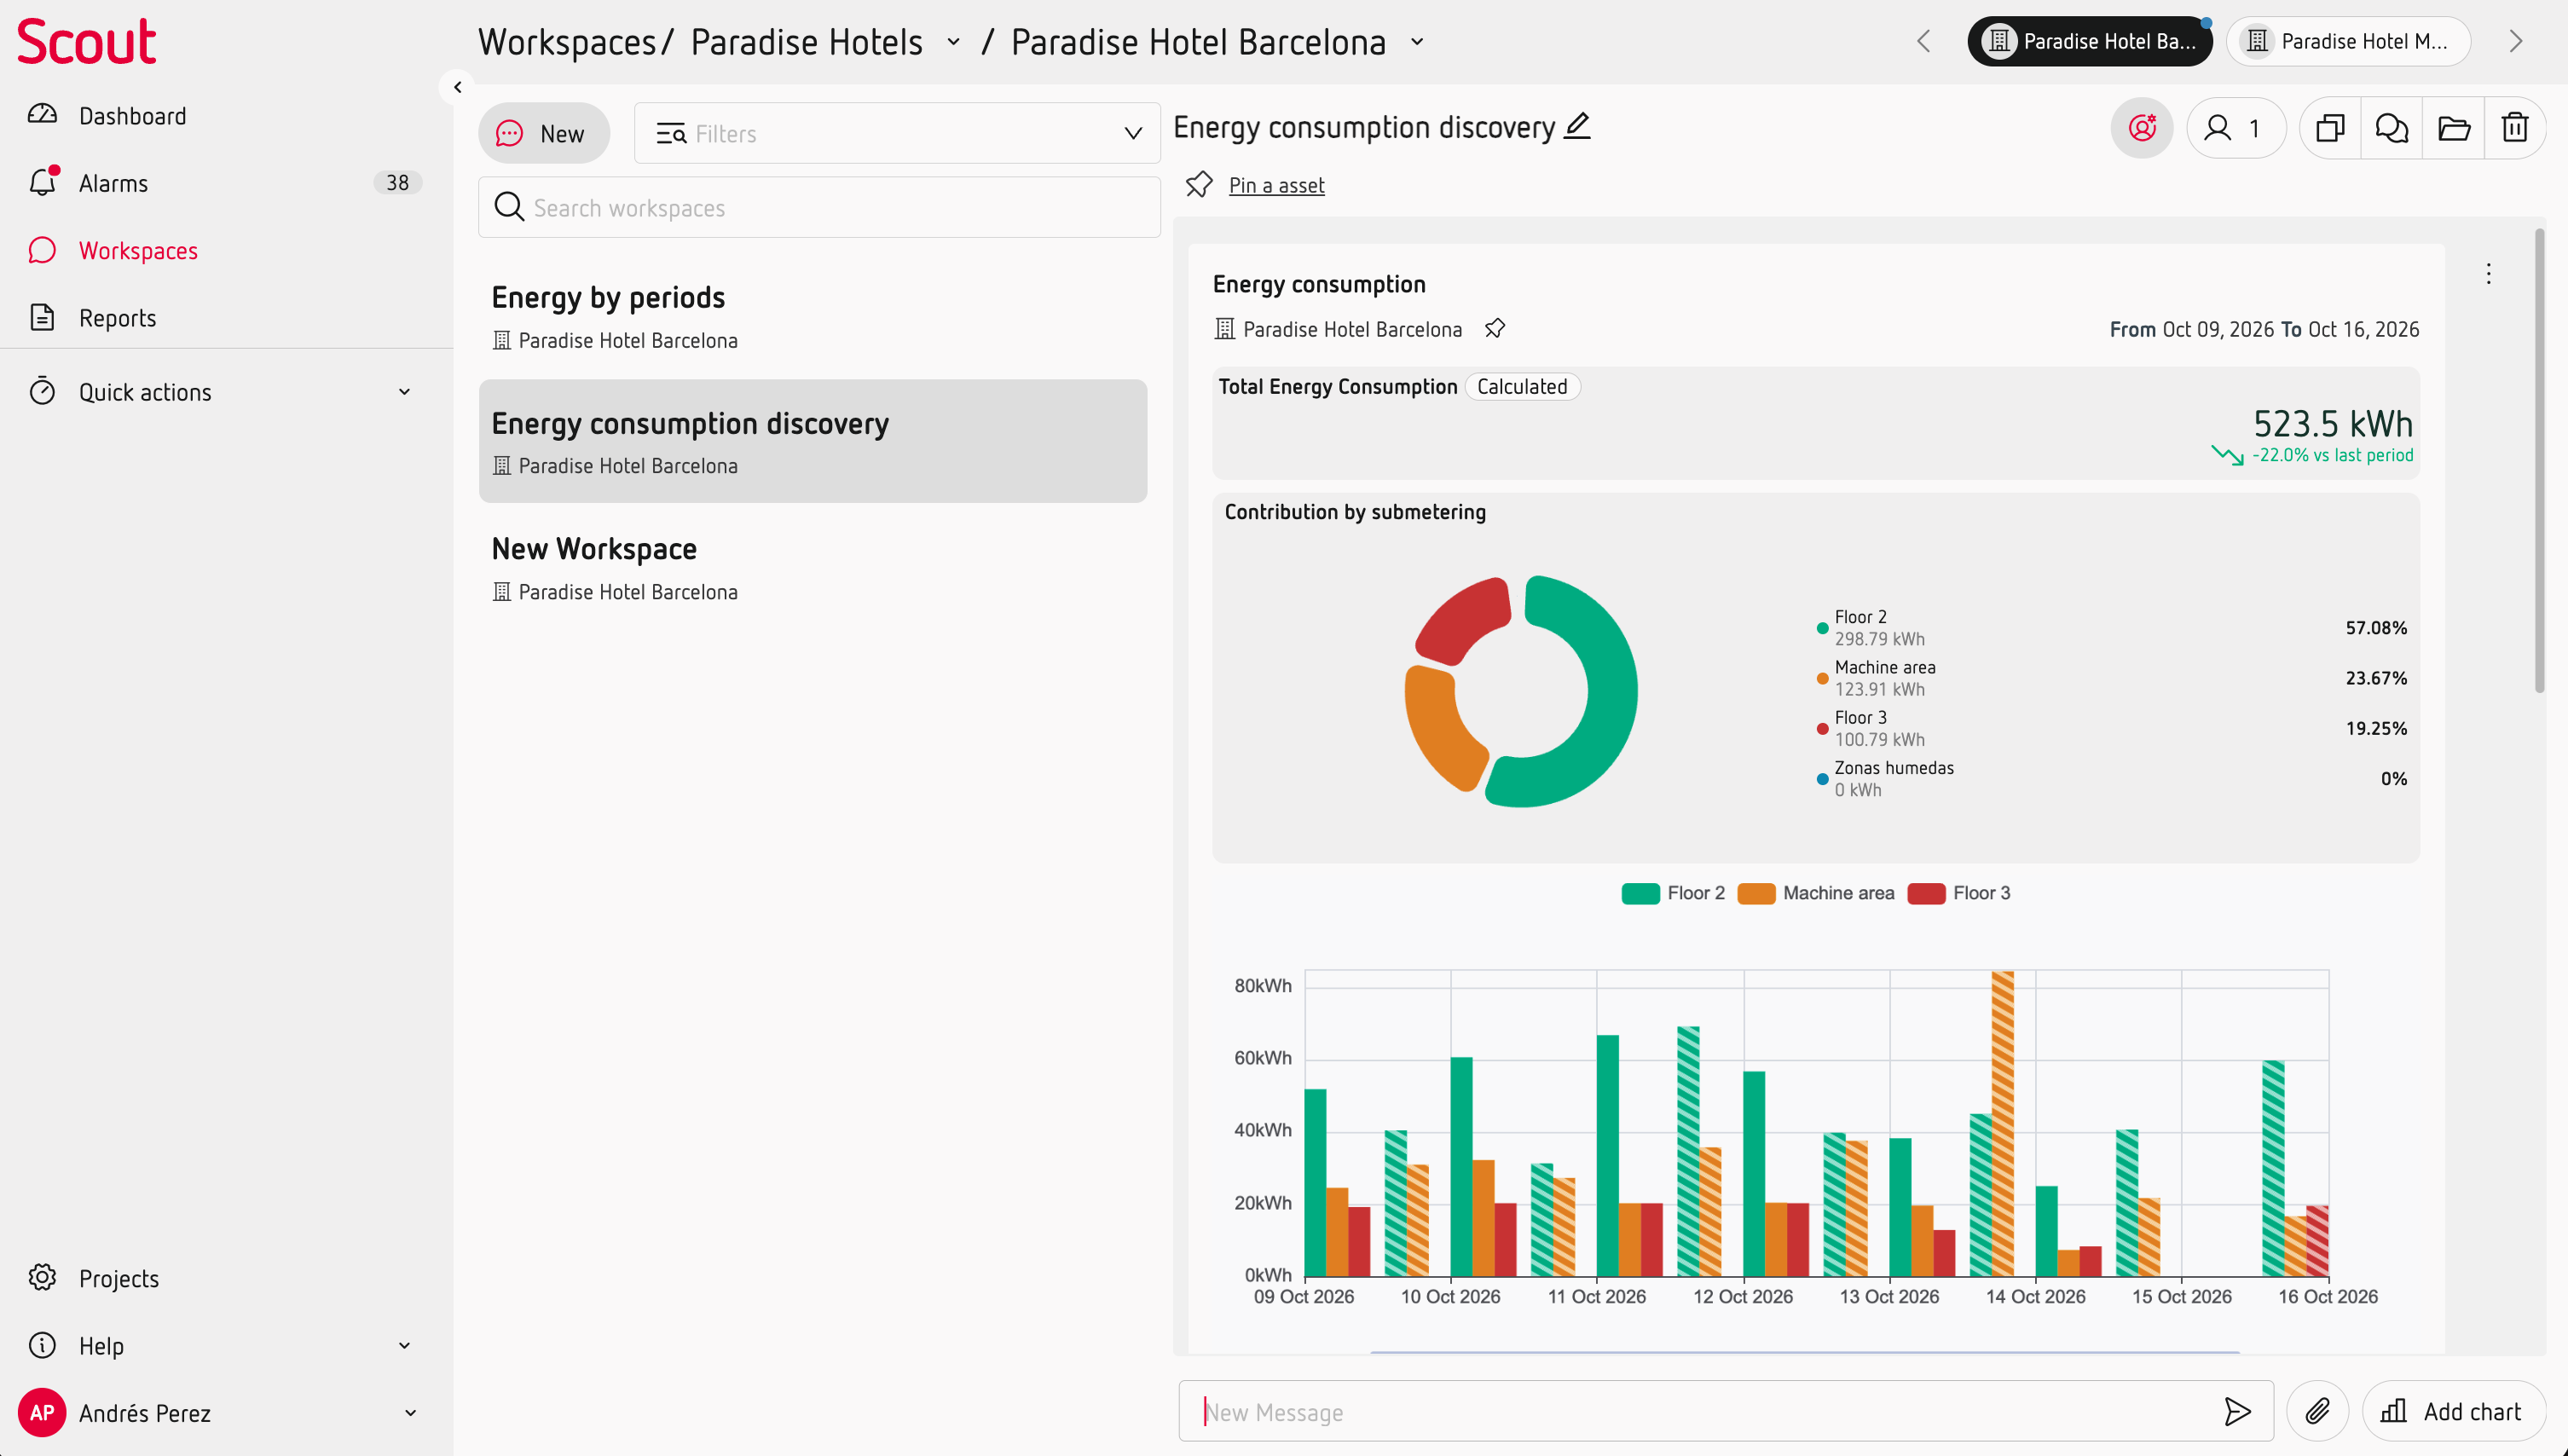
Because the data in a Workspace represents a specific point in time, it is useful for analysing past events, documenting findings and sharing your analysis.
What can you learn?
Use consumption trends to:
- Identify periods with unusually high or low consumption.
- Detect changes in consumption patterns.
- Check the impact of an energy-saving action.
- Compare current performance with previous periods.
- Investigate when a change in consumption started.