Analyse power quality with the ITIC curve
Use the ITIC curve to understand the relevance of power quality events in your installation.
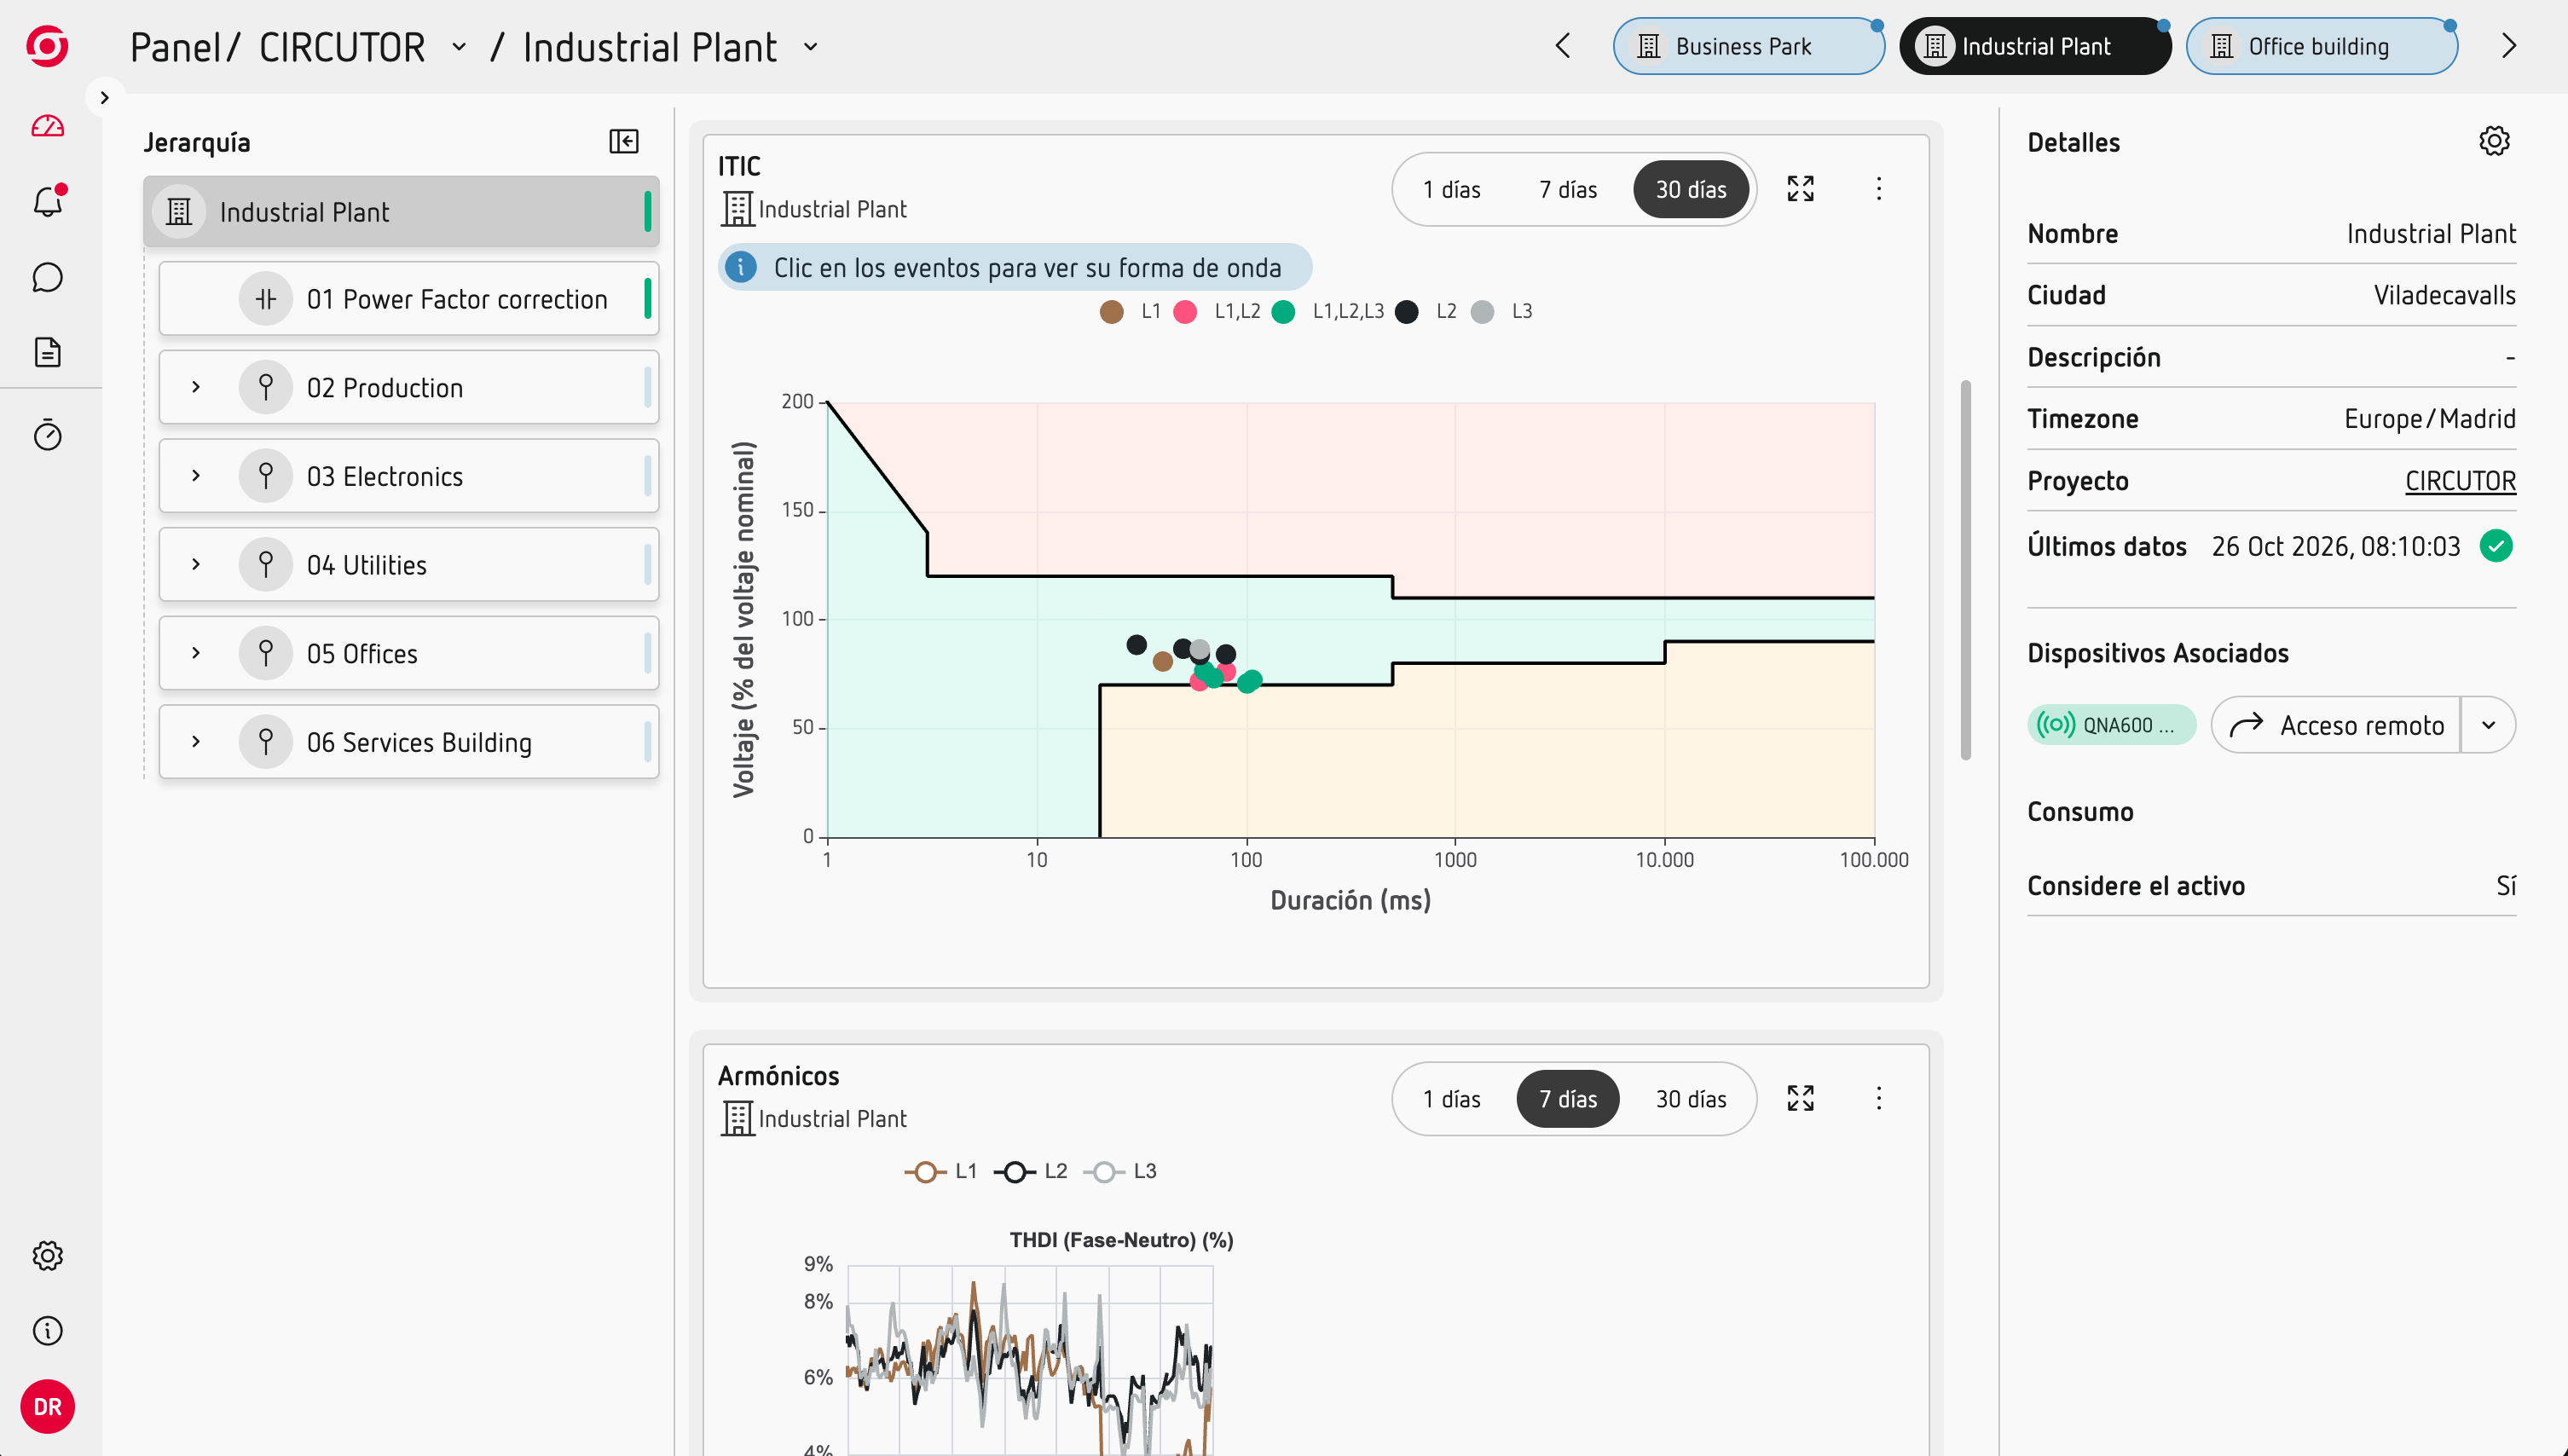
The ITIC curve provides a simple way to visualise voltage events according to their magnitude and duration.
See where your events fall
Scout plots power quality events on the ITIC curve, so you can quickly see how each event compares with the expected operating range.
Events are classified according to their position on the curve, helping you identify which events may require further investigation.
Investigate the events that matter
Use the ITIC curve to:
- Identify relevant voltage events at a glance.
- Understand the magnitude and duration of an event.
- Compare different events.
- Focus your analysis on the events that require attention.
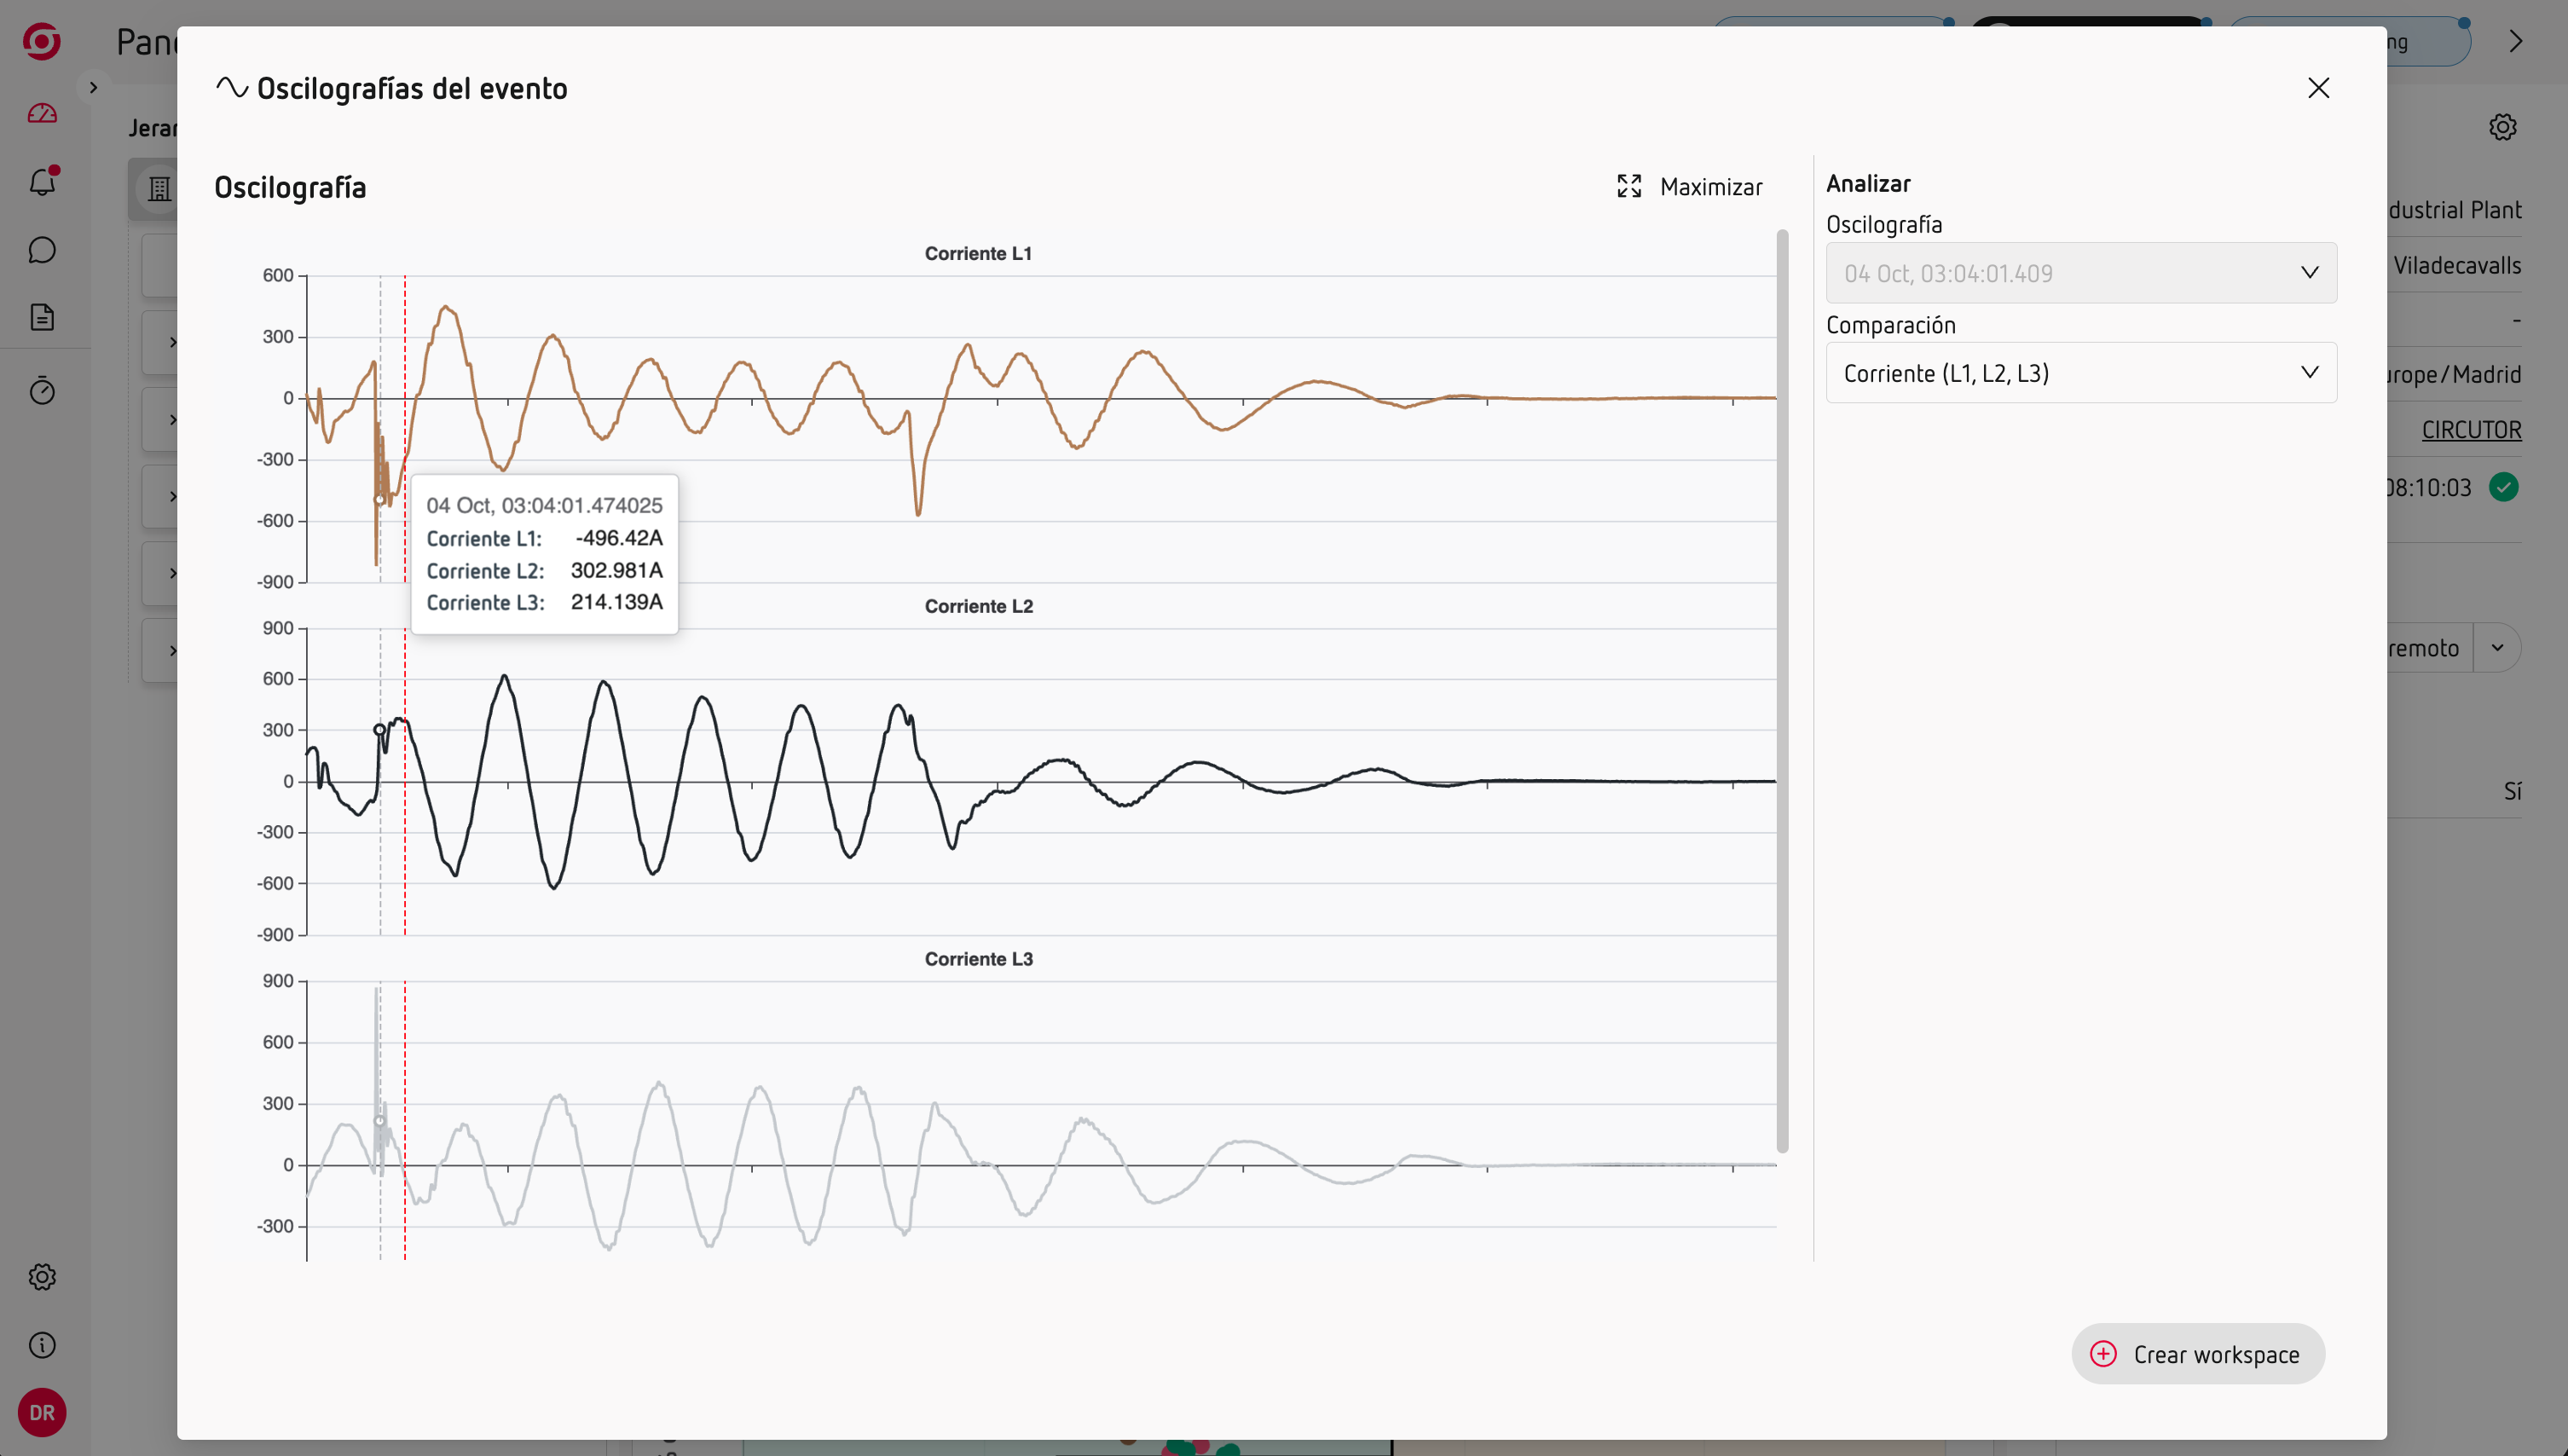
Select an event to access its detailed information and, when available, its waveform.
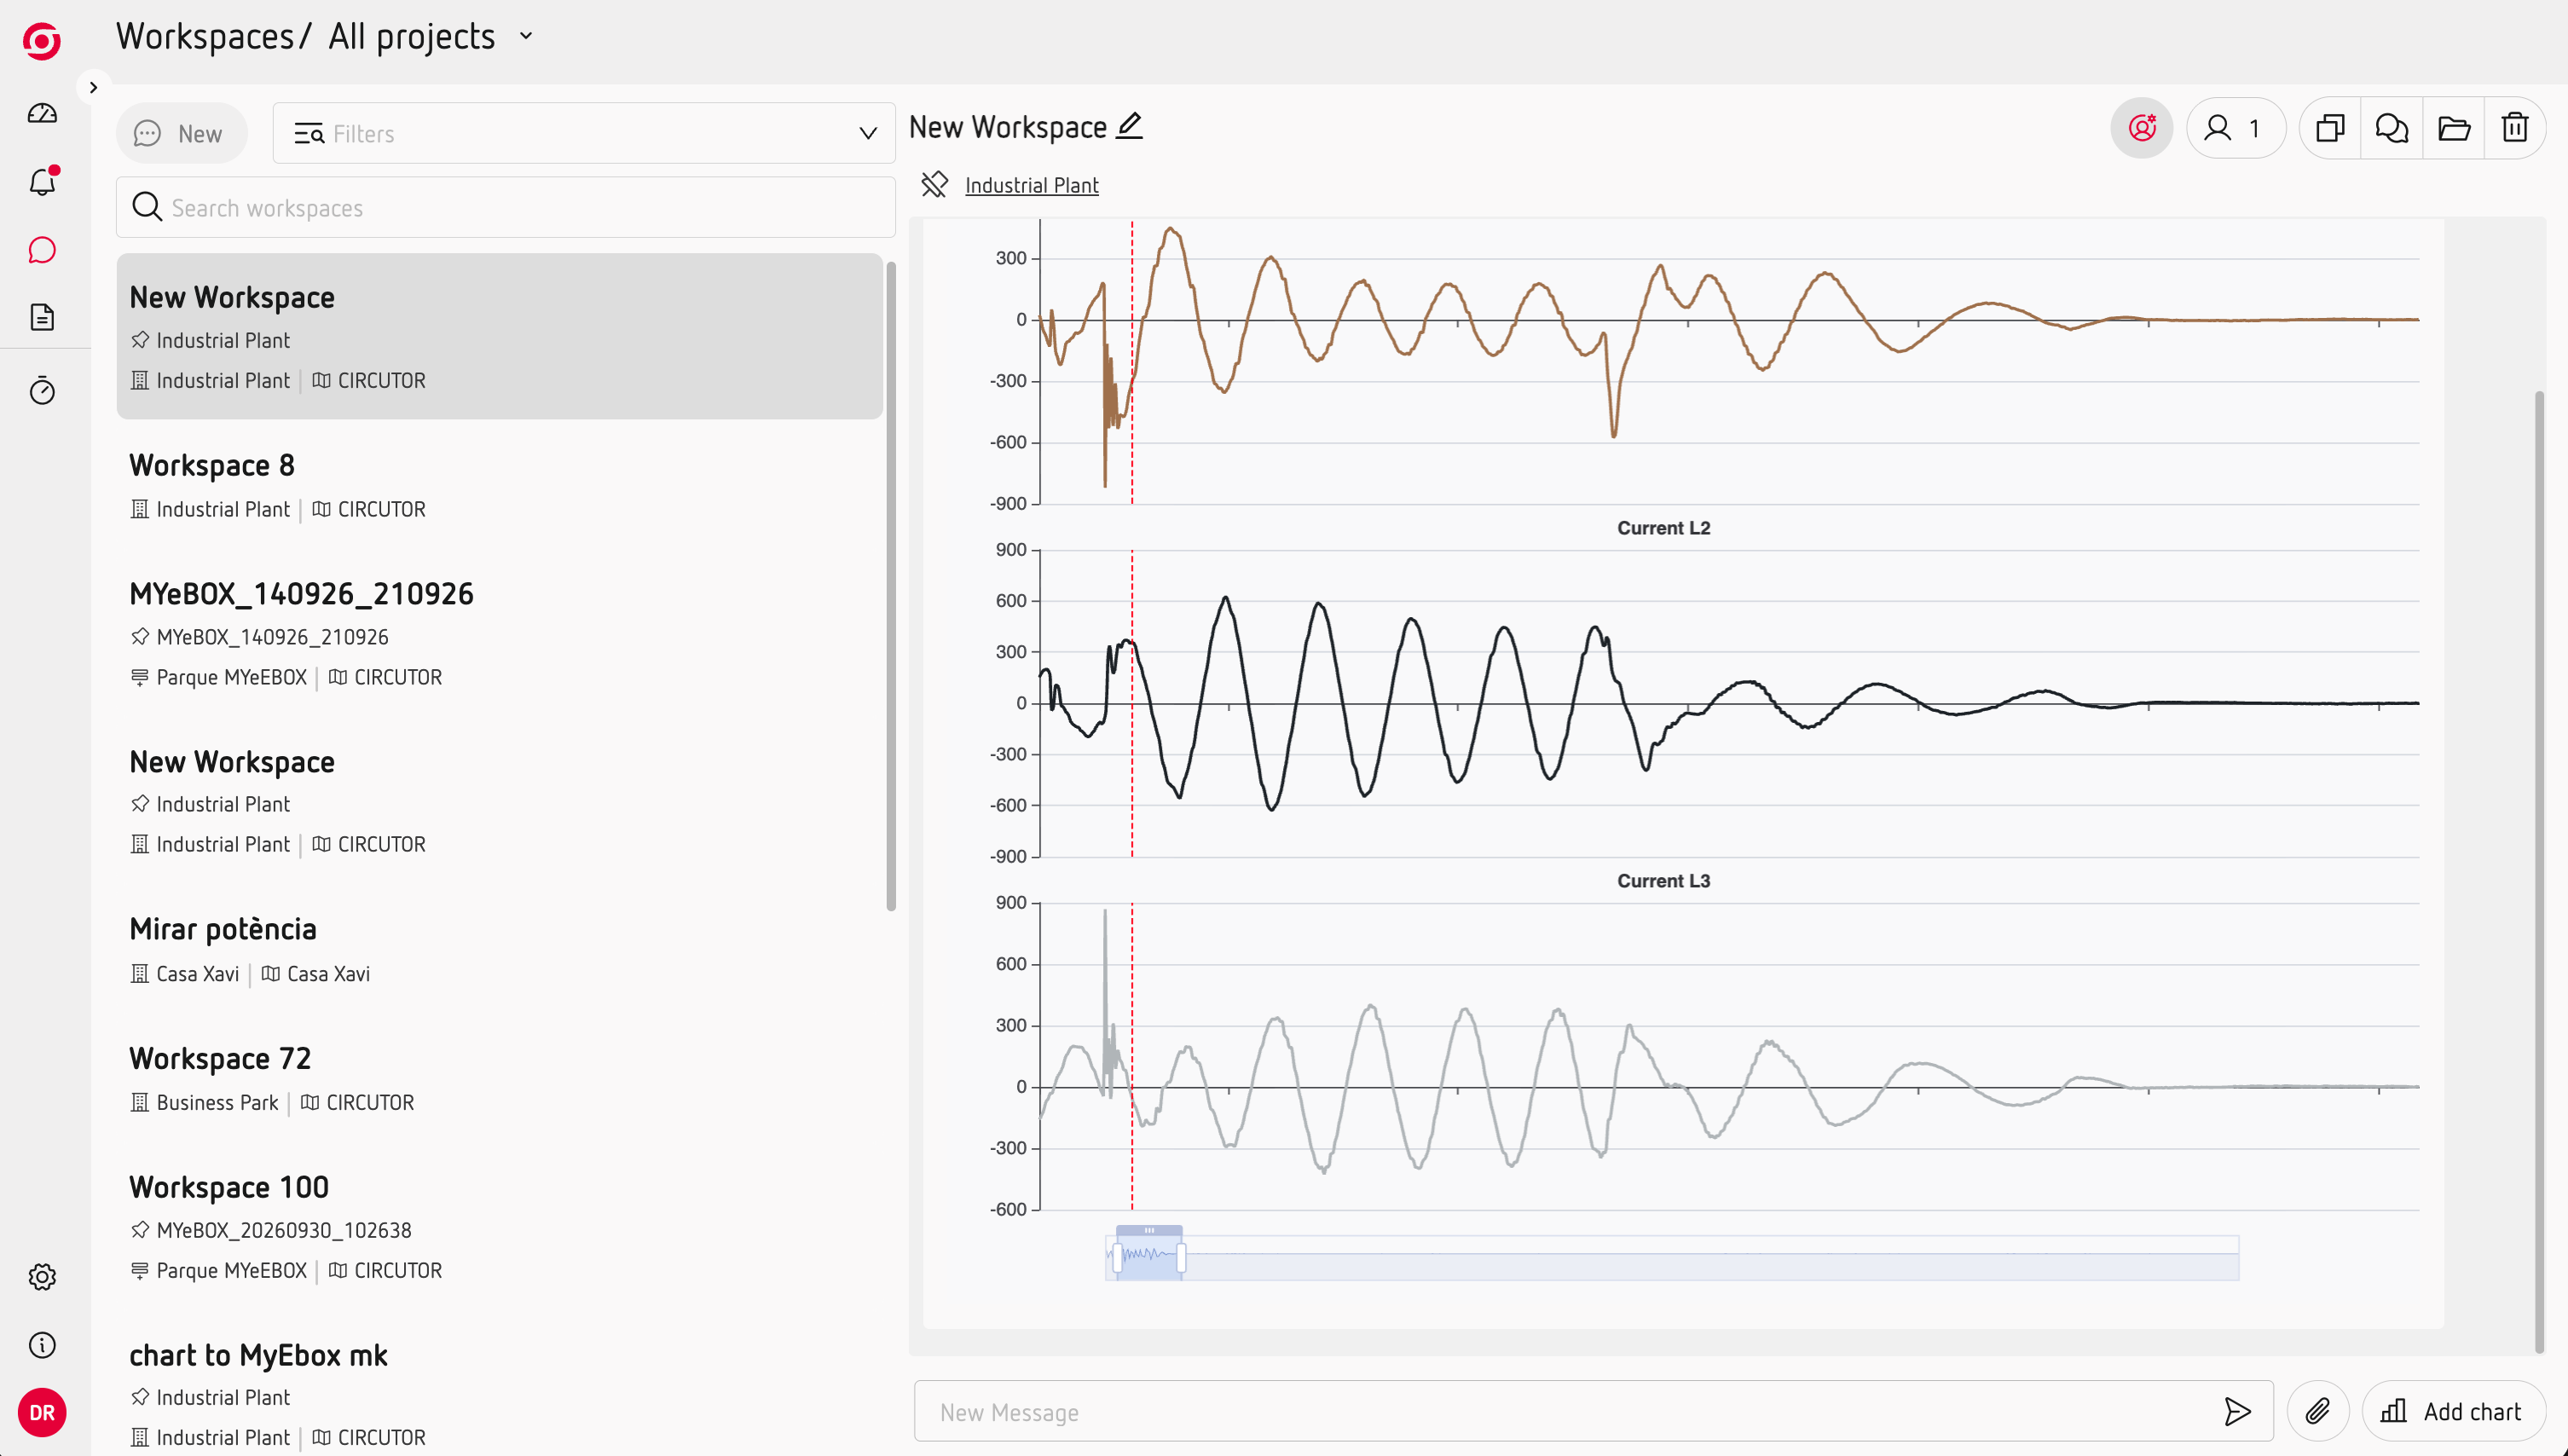
You can also create a Workspace from the event to investigate the surrounding measurements in more detail.