Understand your energy consumption
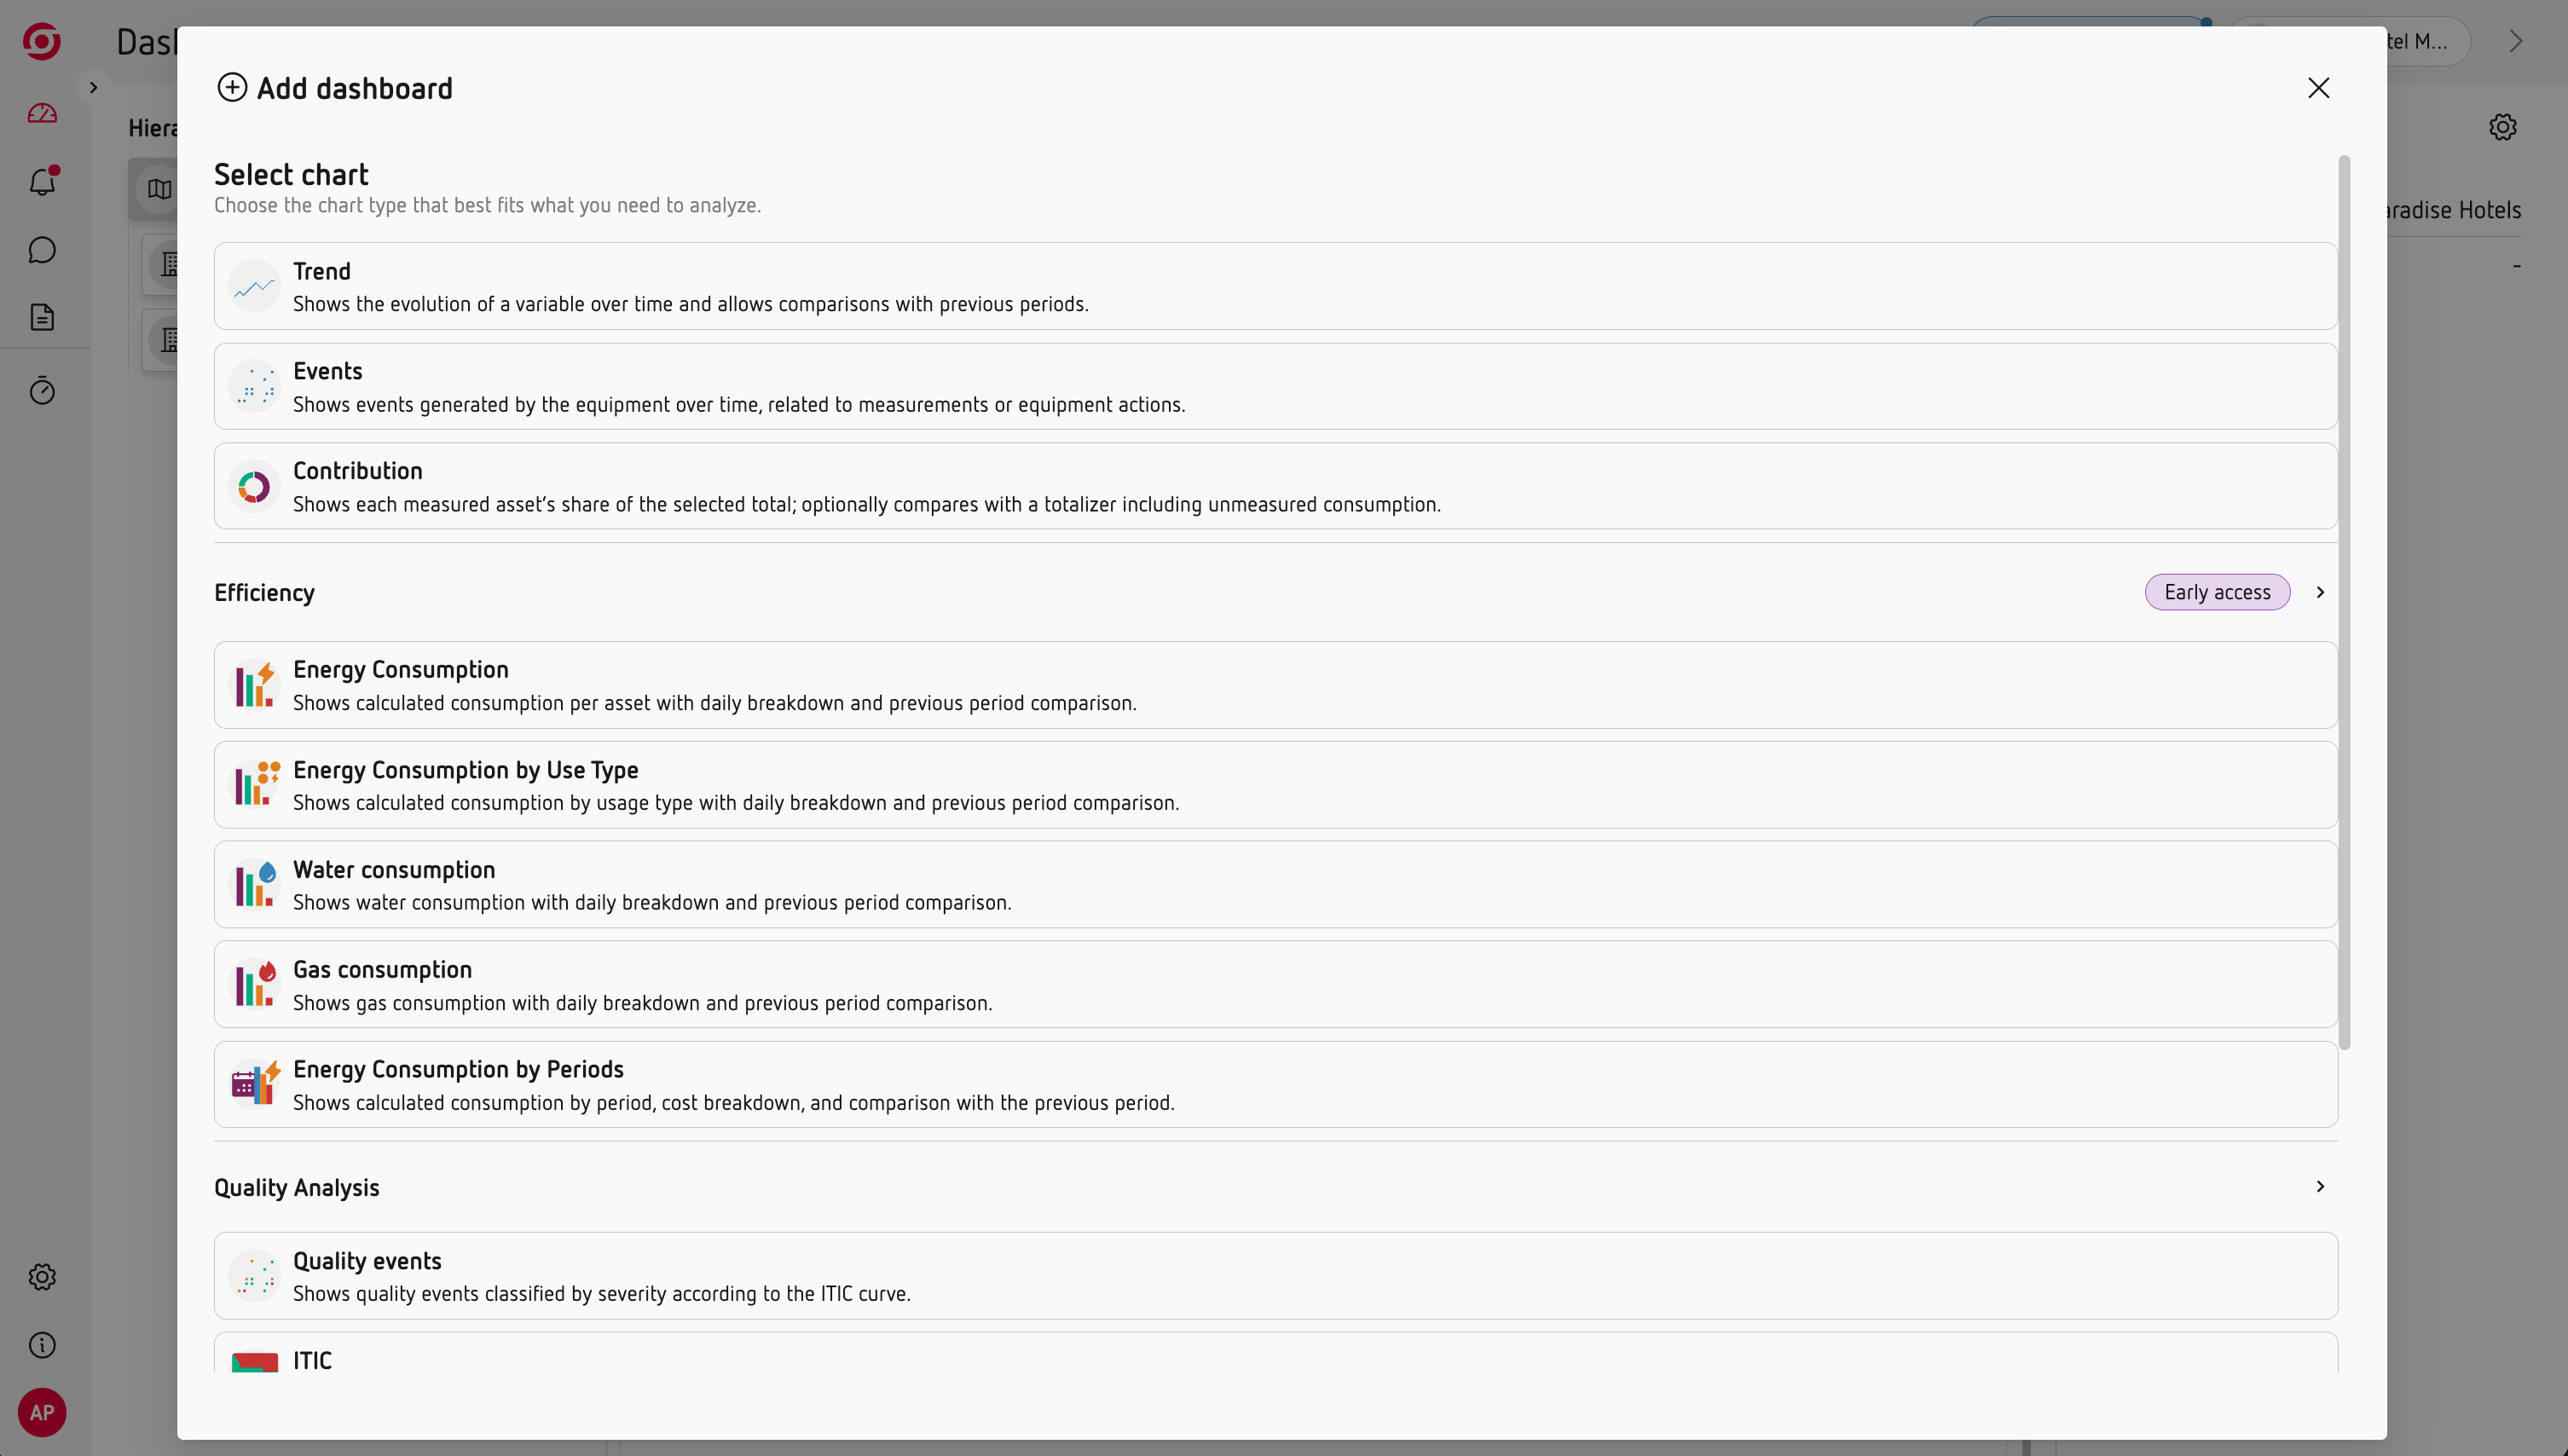
Use Consumption Charts to see how much energy you consume and how it is distributed across your installation.
Scout helps you understand not only how much energy your installation consumes, but also where and when that energy is being used.
Use the consumption charts in your dashboard to get a quick overview of your installation and explore the areas that matter most.
See your consumption at a glance
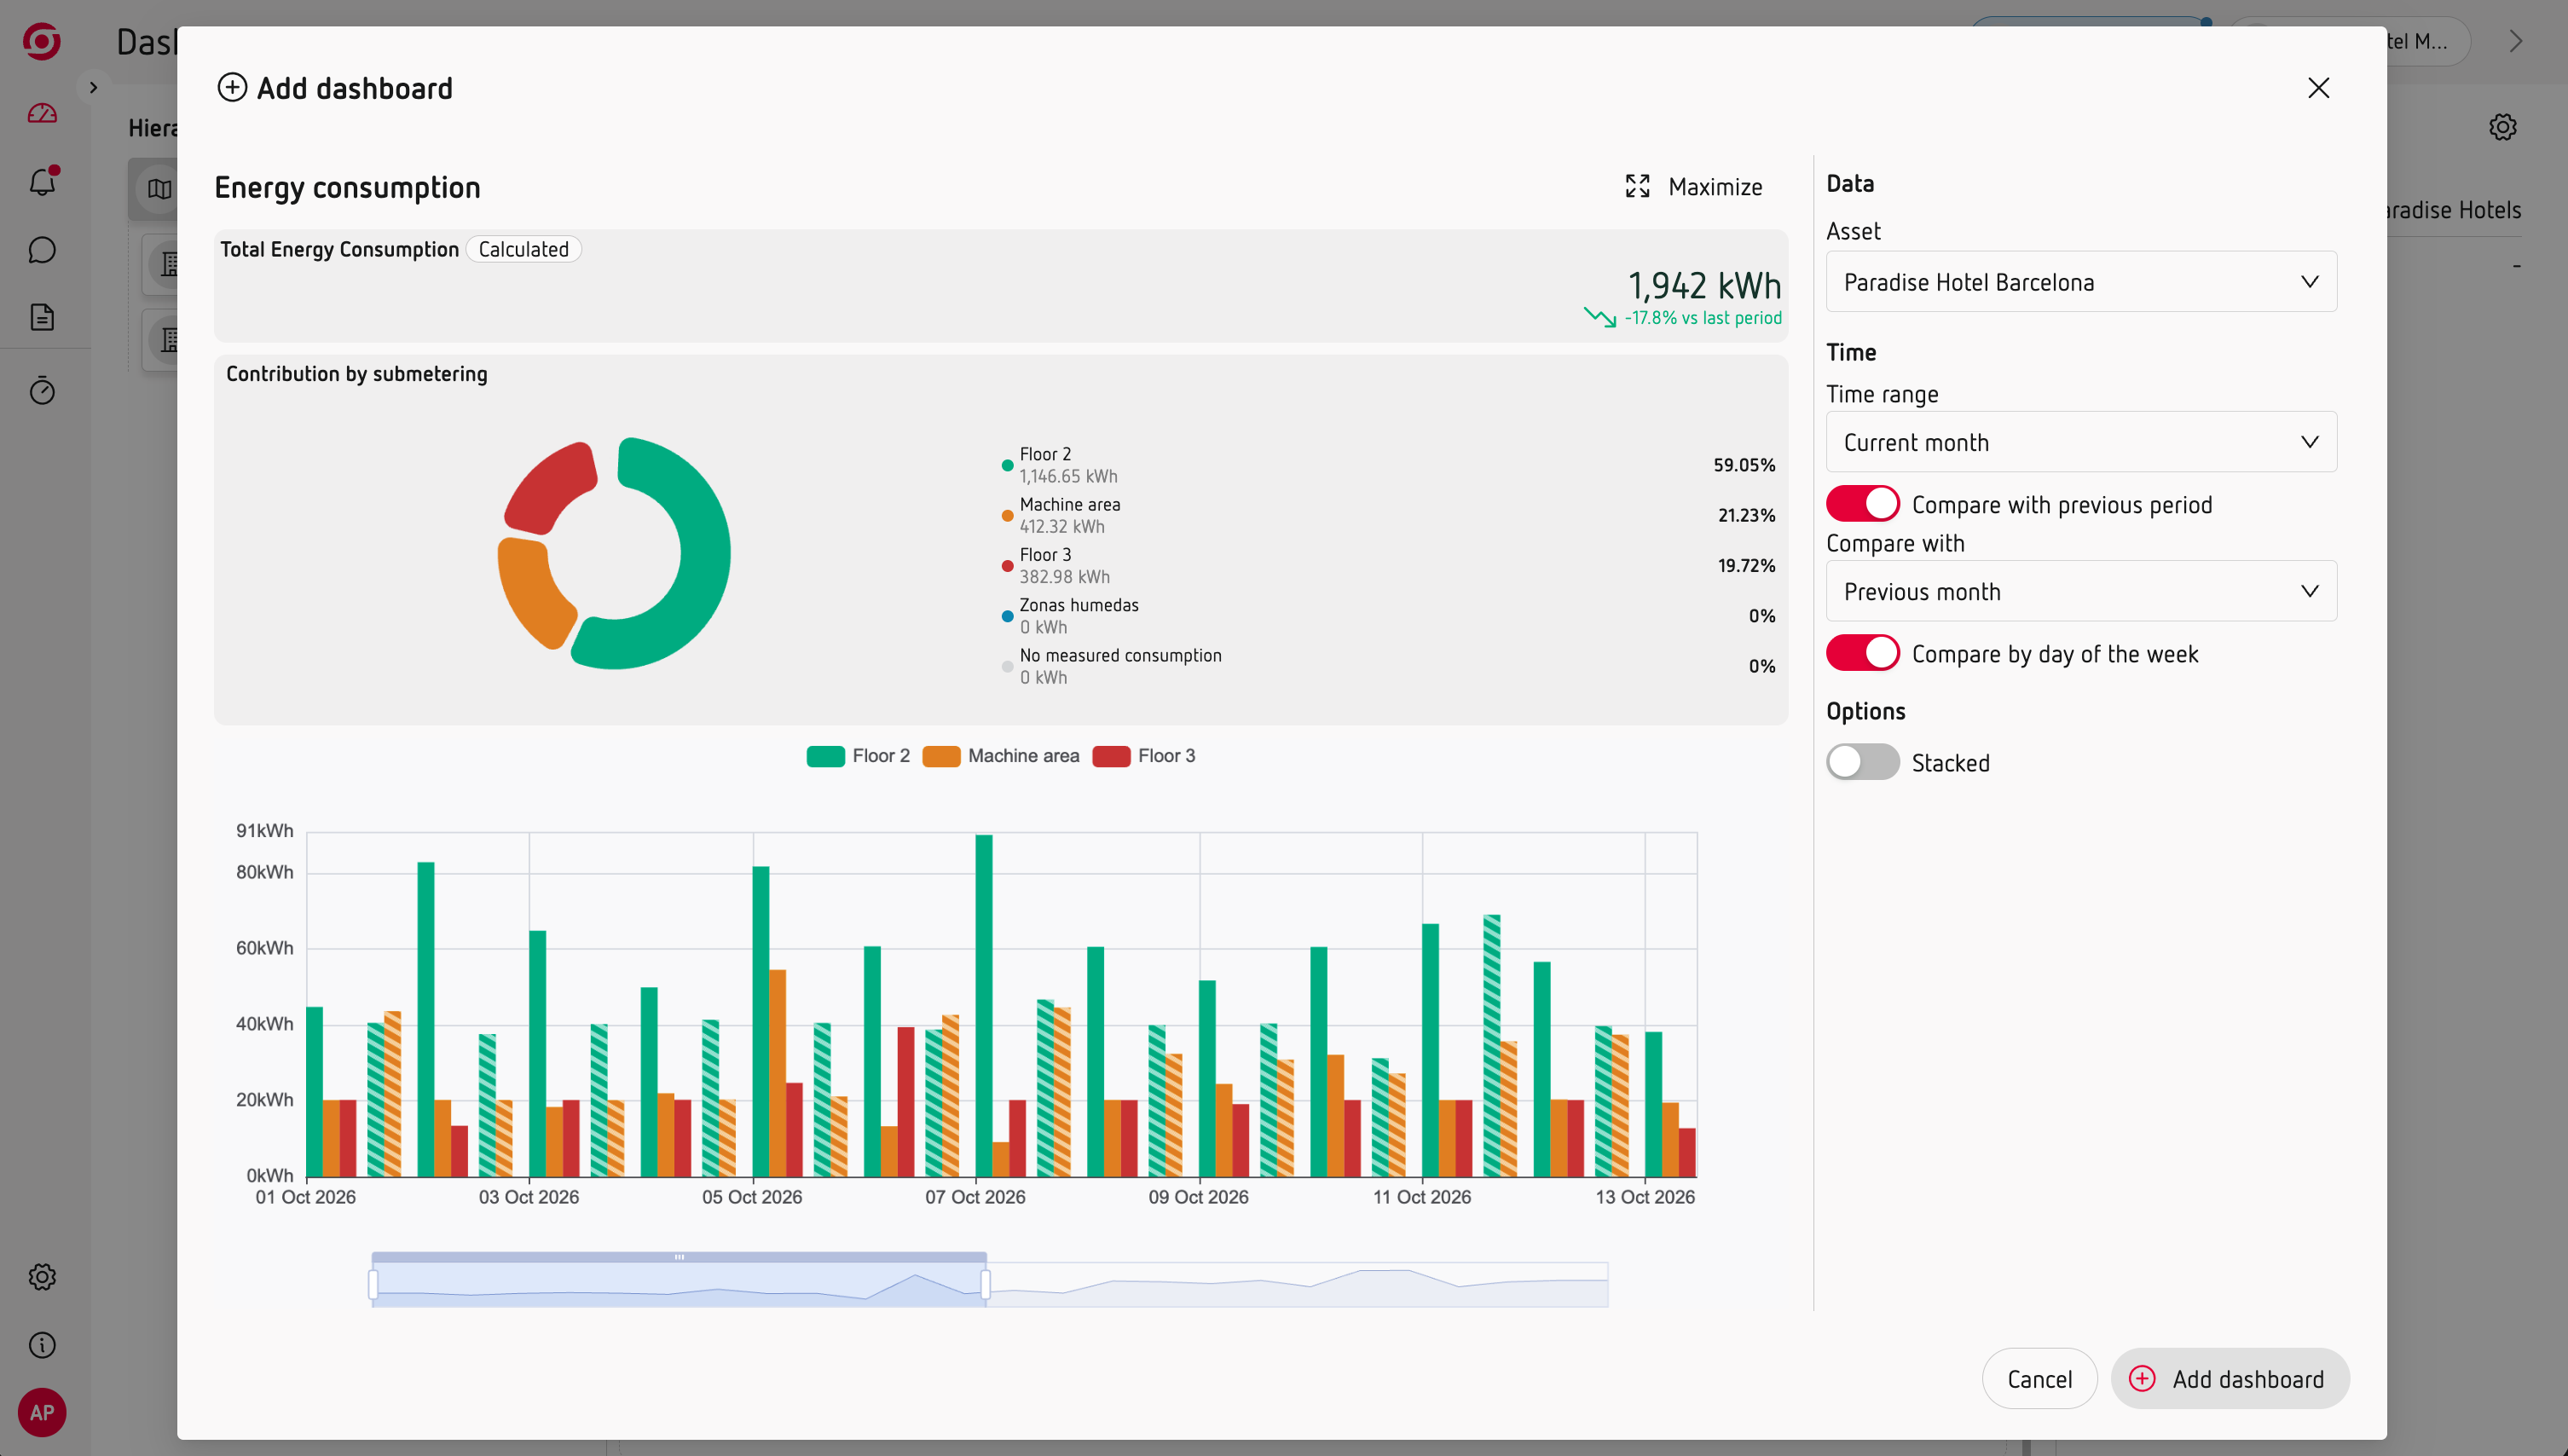
The Consumption chart shows the energy consumption of an asset and, when available, the contribution of its child assets.
You can view:
- Current month, with daily data.
- Last 30 days, with daily data.
- Last year, with monthly data.
You can also compare the selected period with the previous period or with the same period last year (YoY).
Understand where your energy is being used
The chart shows the contribution of each child asset, making it easy to see how consumption is distributed across your installation.
For example, you can use it to compare buildings, areas or other parts of your asset hierarchy and quickly identify where most of the energy is being consumed.
Good to know
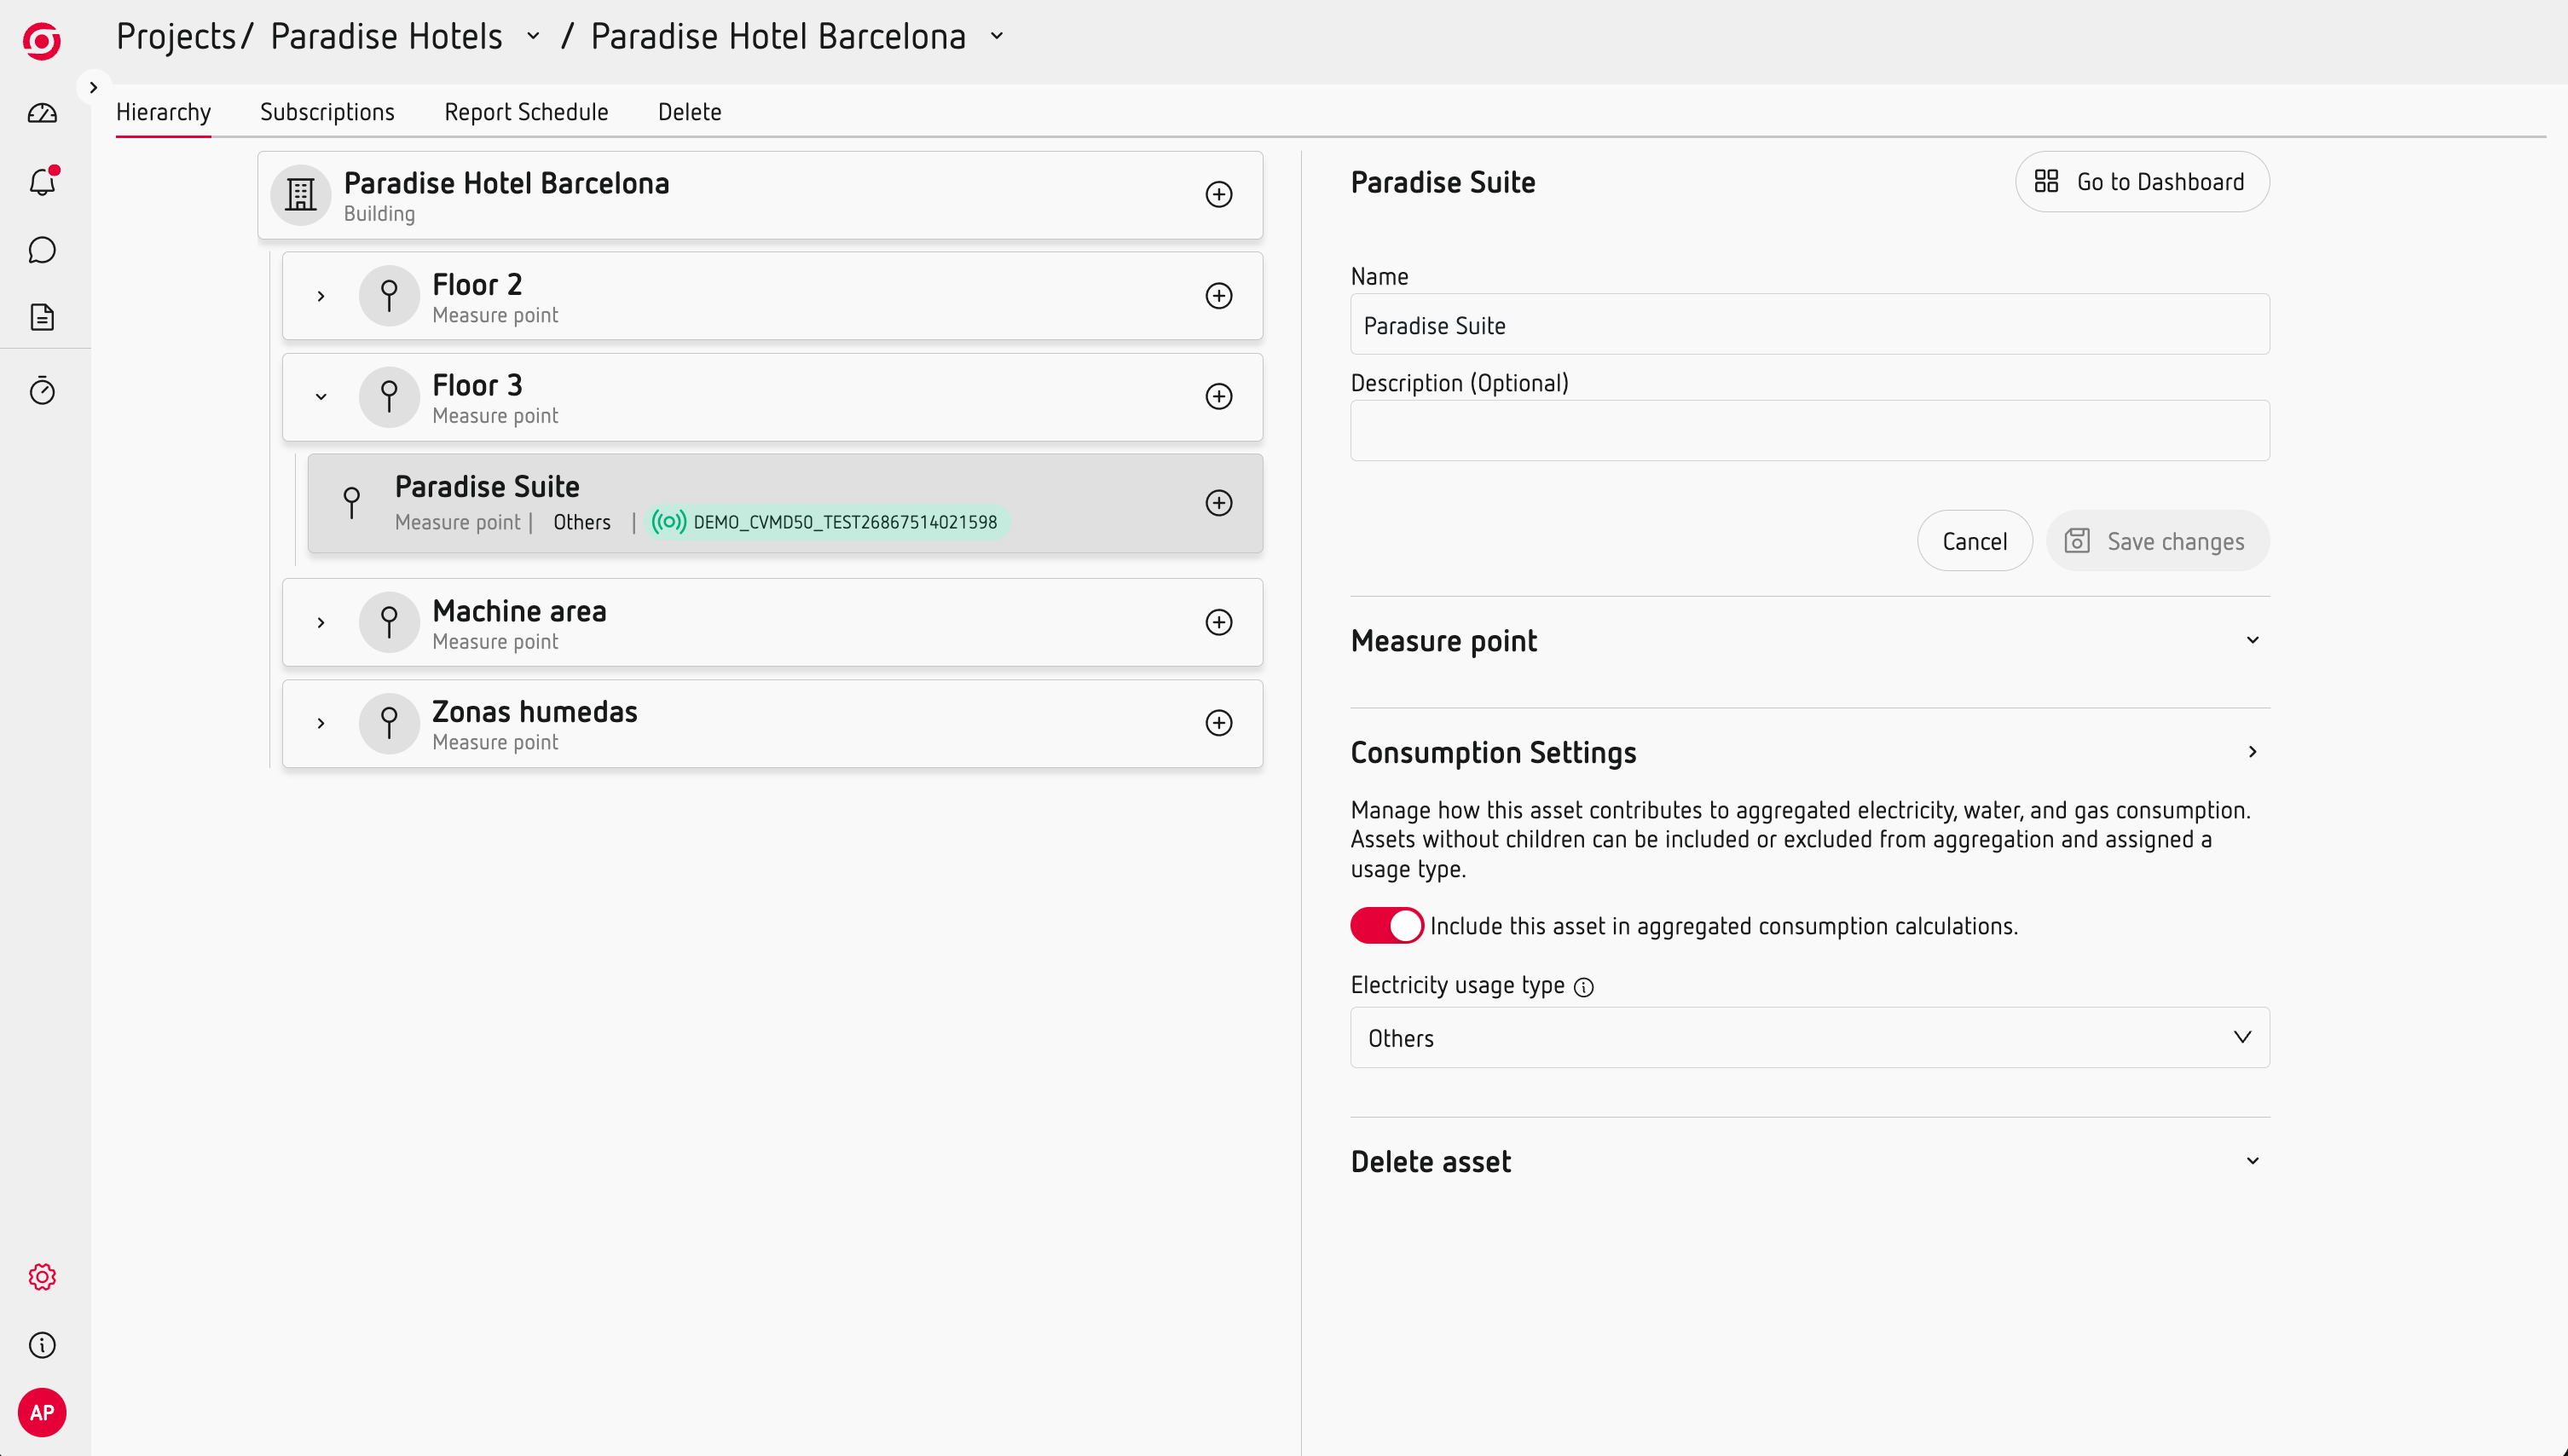
An asset's consumption is calculated from the consumption of its child assets when they have consumption measurements. You can exclude a child asset from this calculation in Project configuration.
Look beyond electricity
The same approach can be used to monitor water and gas consumption, when these measurements are available in your project.
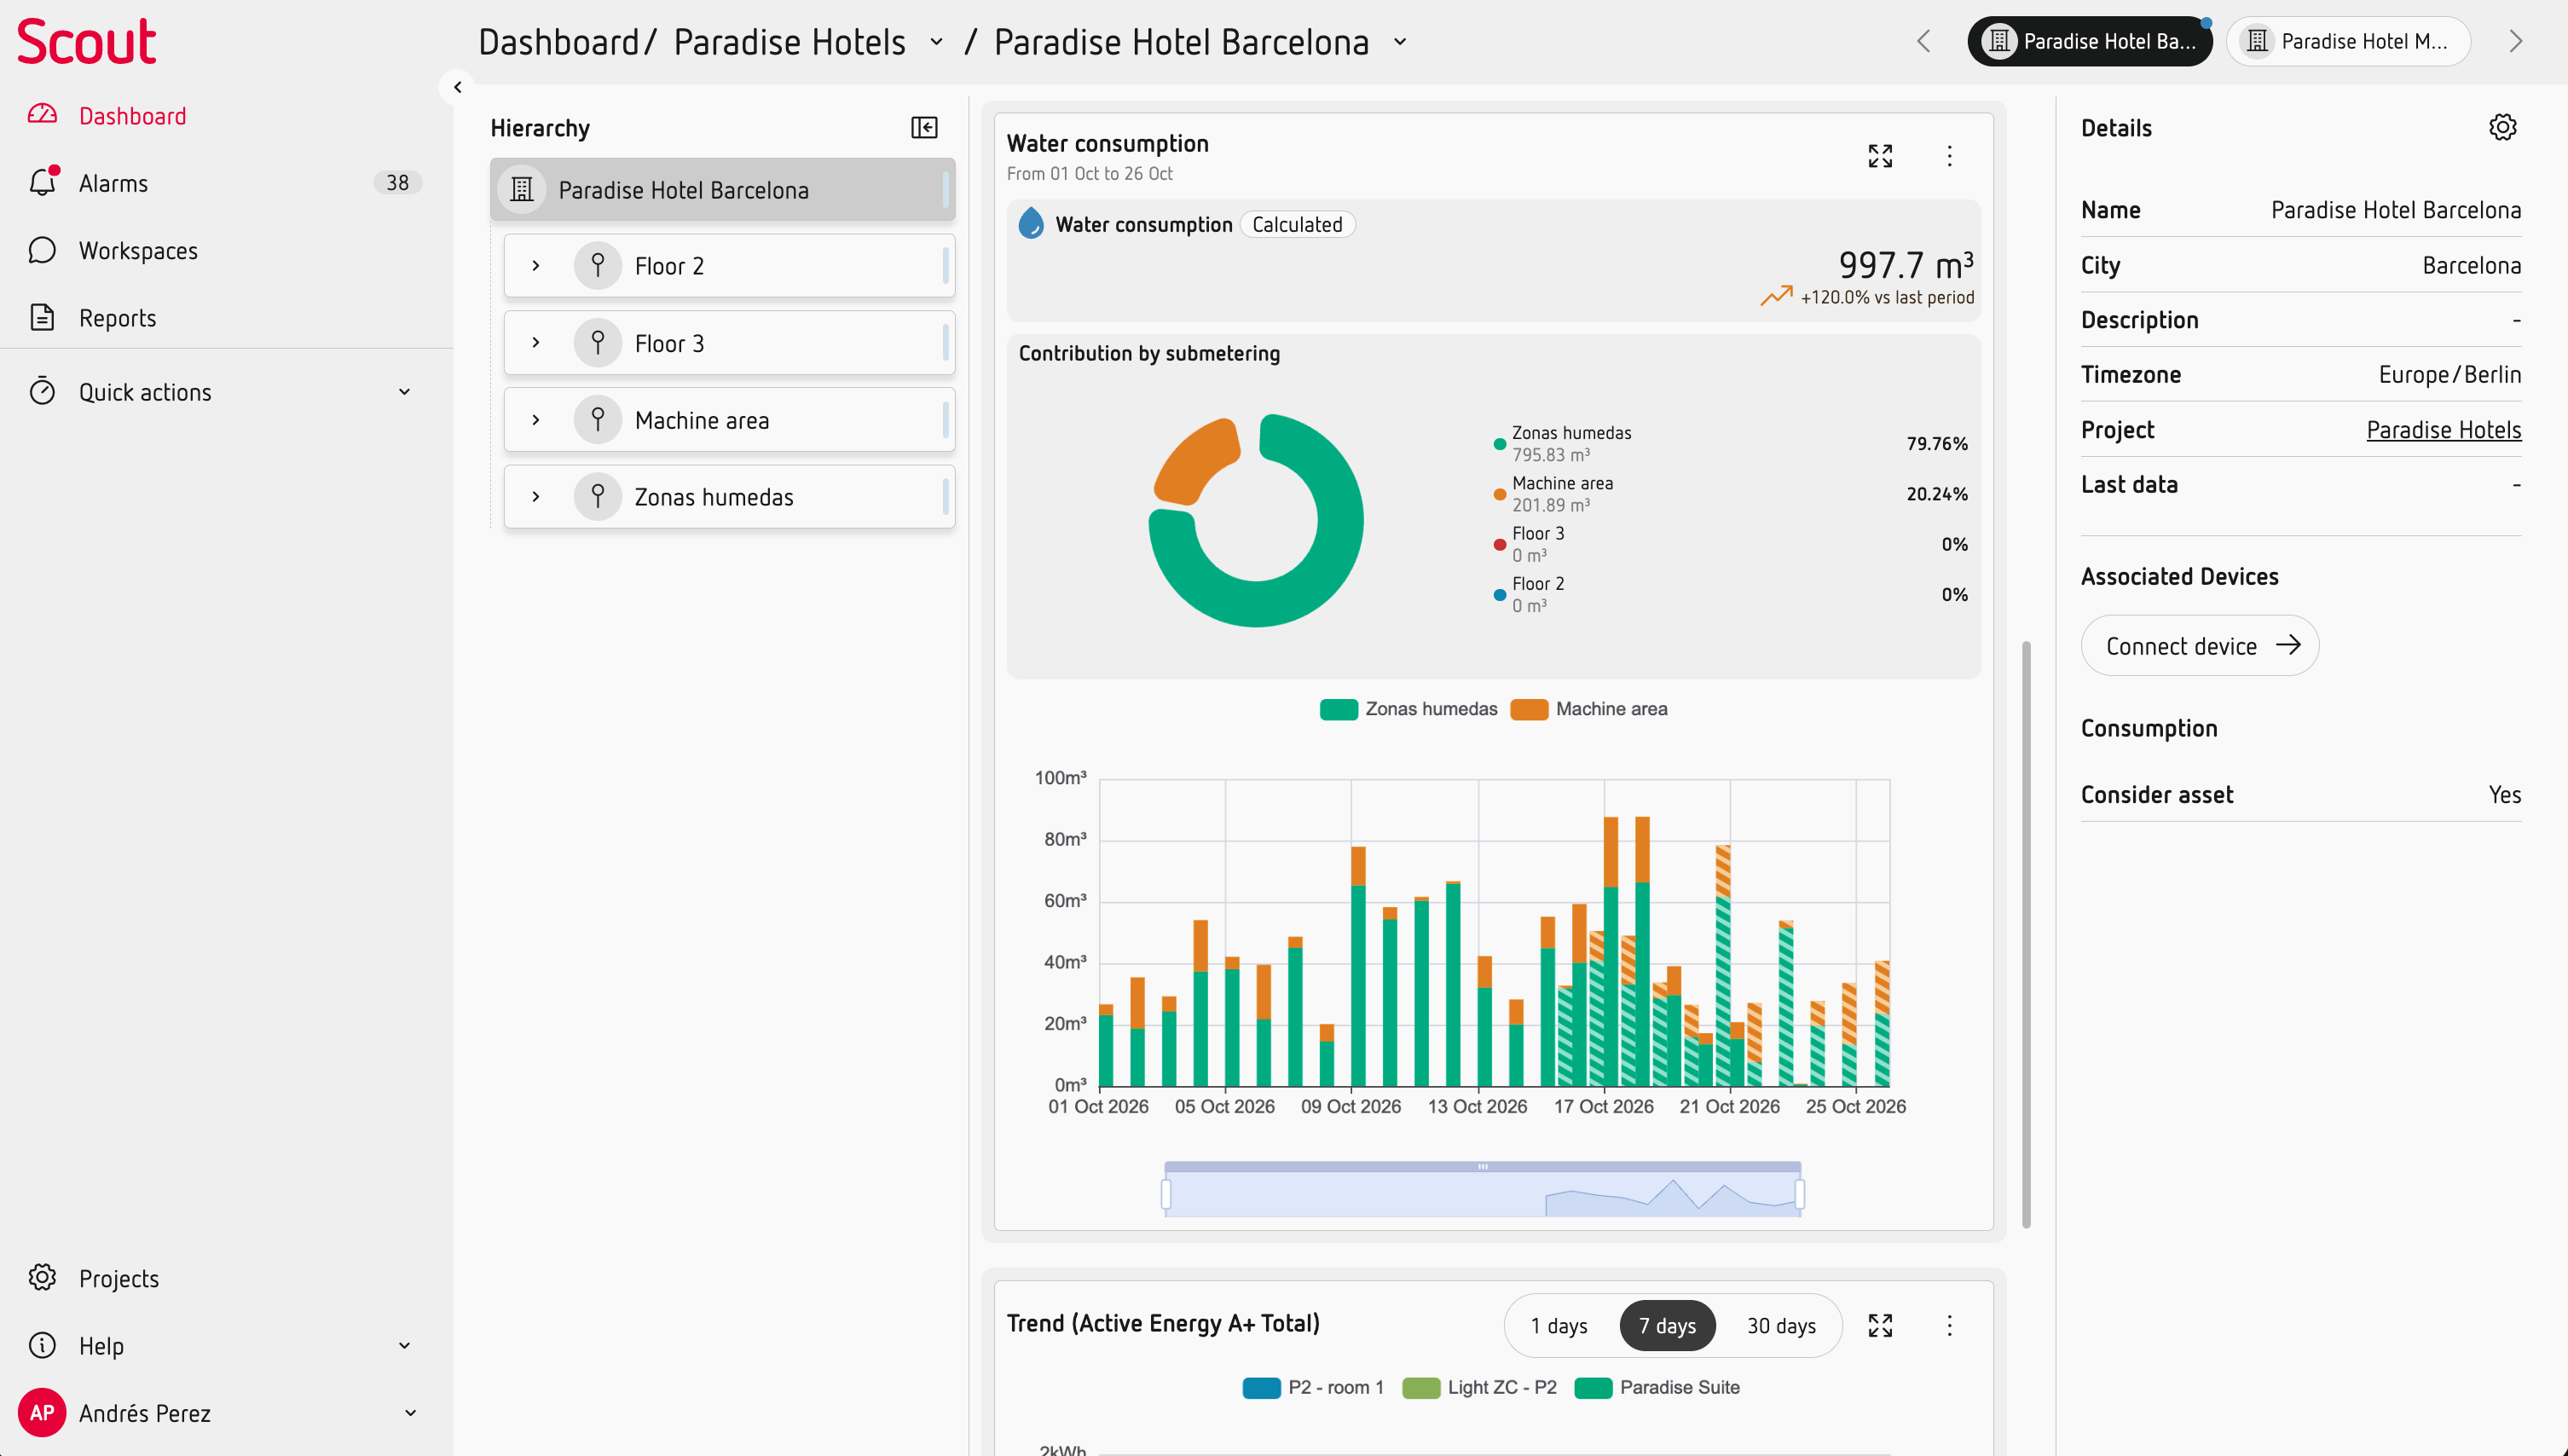
Explore your consumption
Once you understand your overall consumption, you can use Scout to go further:
- Analyse consumption over time to identify changes and trends.
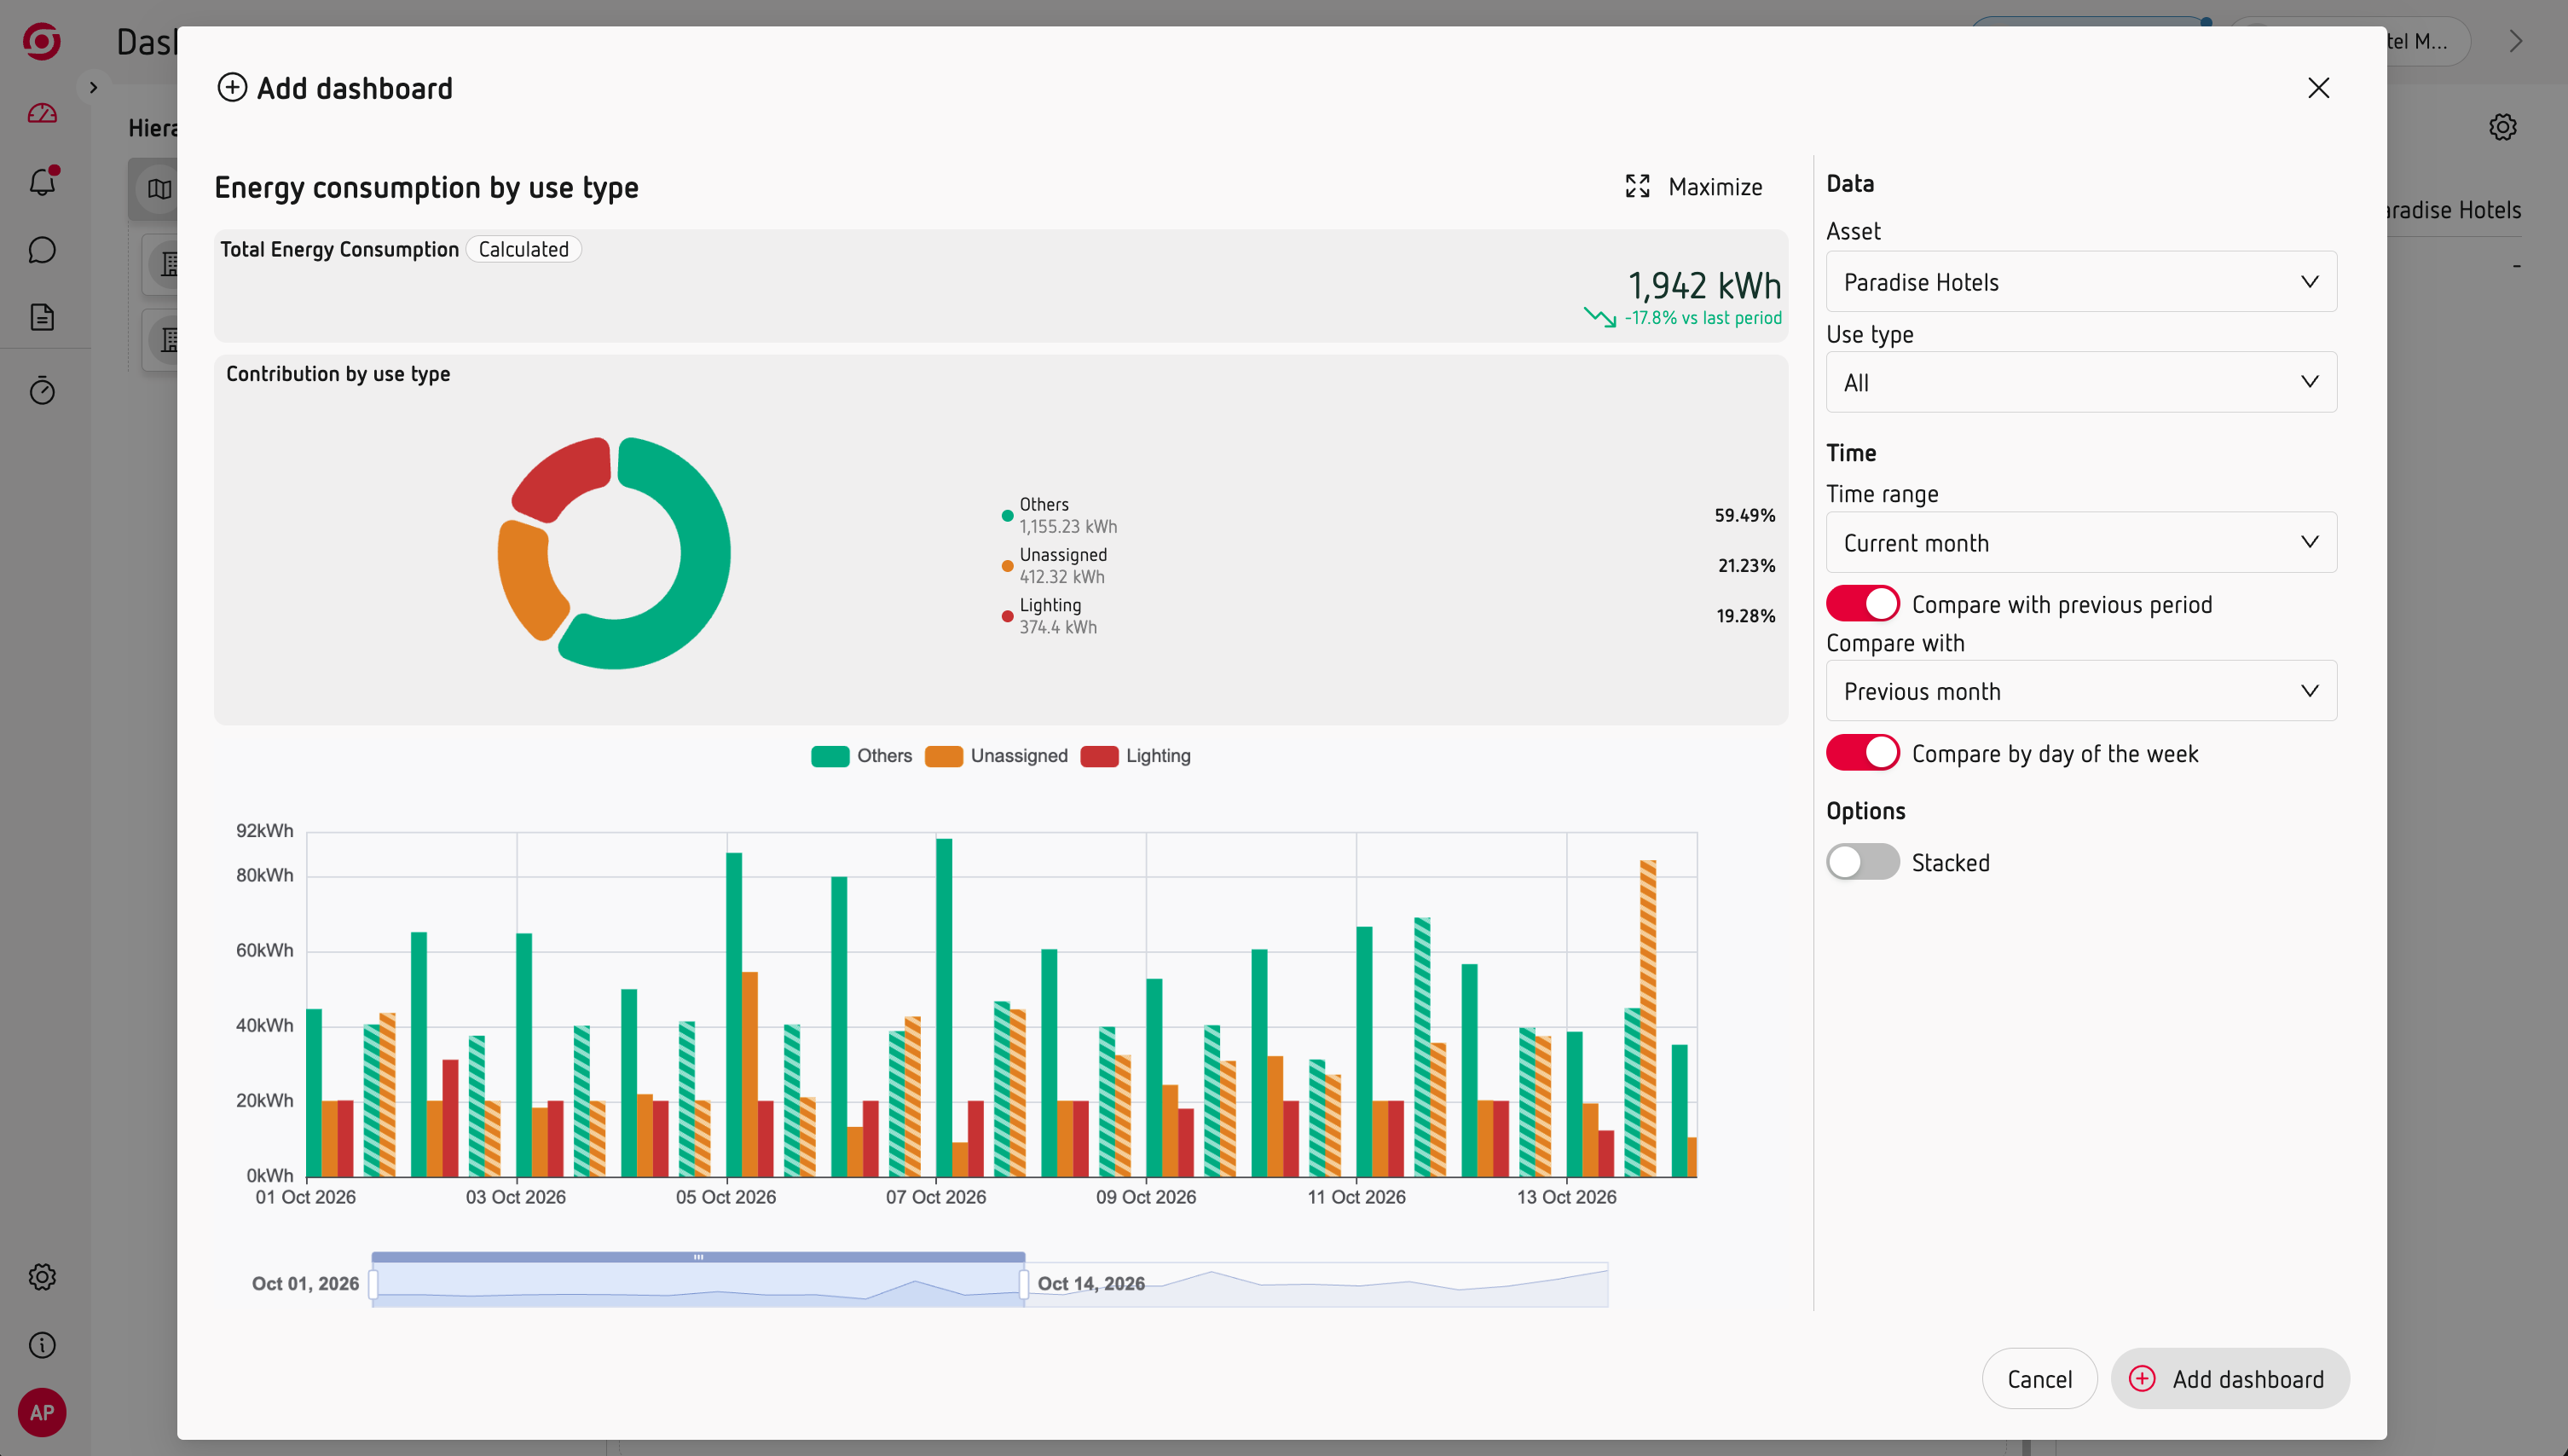
- Understand how your energy is being used by grouping consumption by usage type.
- Analyse energy costs by tariff period.
- Get a complete overview of your consumption with the Consumption Report.