Use your data wherever you need it
Export data from Trend Charts to CSV or copy charts as images to continue working with your Scout data outside the platform.
Scout gives you different ways to take your data and analysis with you.
Export measurements to CSV
When you need to work with the measurements outside Scout, you can export the data displayed in a Trend Chart to CSV.
The exported file contains the measurements shown in the chart, so you can continue working with them in Excel or another compatible tool.
This is useful when you want to:
- Perform your own calculations.
- Prepare a custom report.
- Combine Scout data with information from other systems.
- Share measurement data with colleagues or customers.
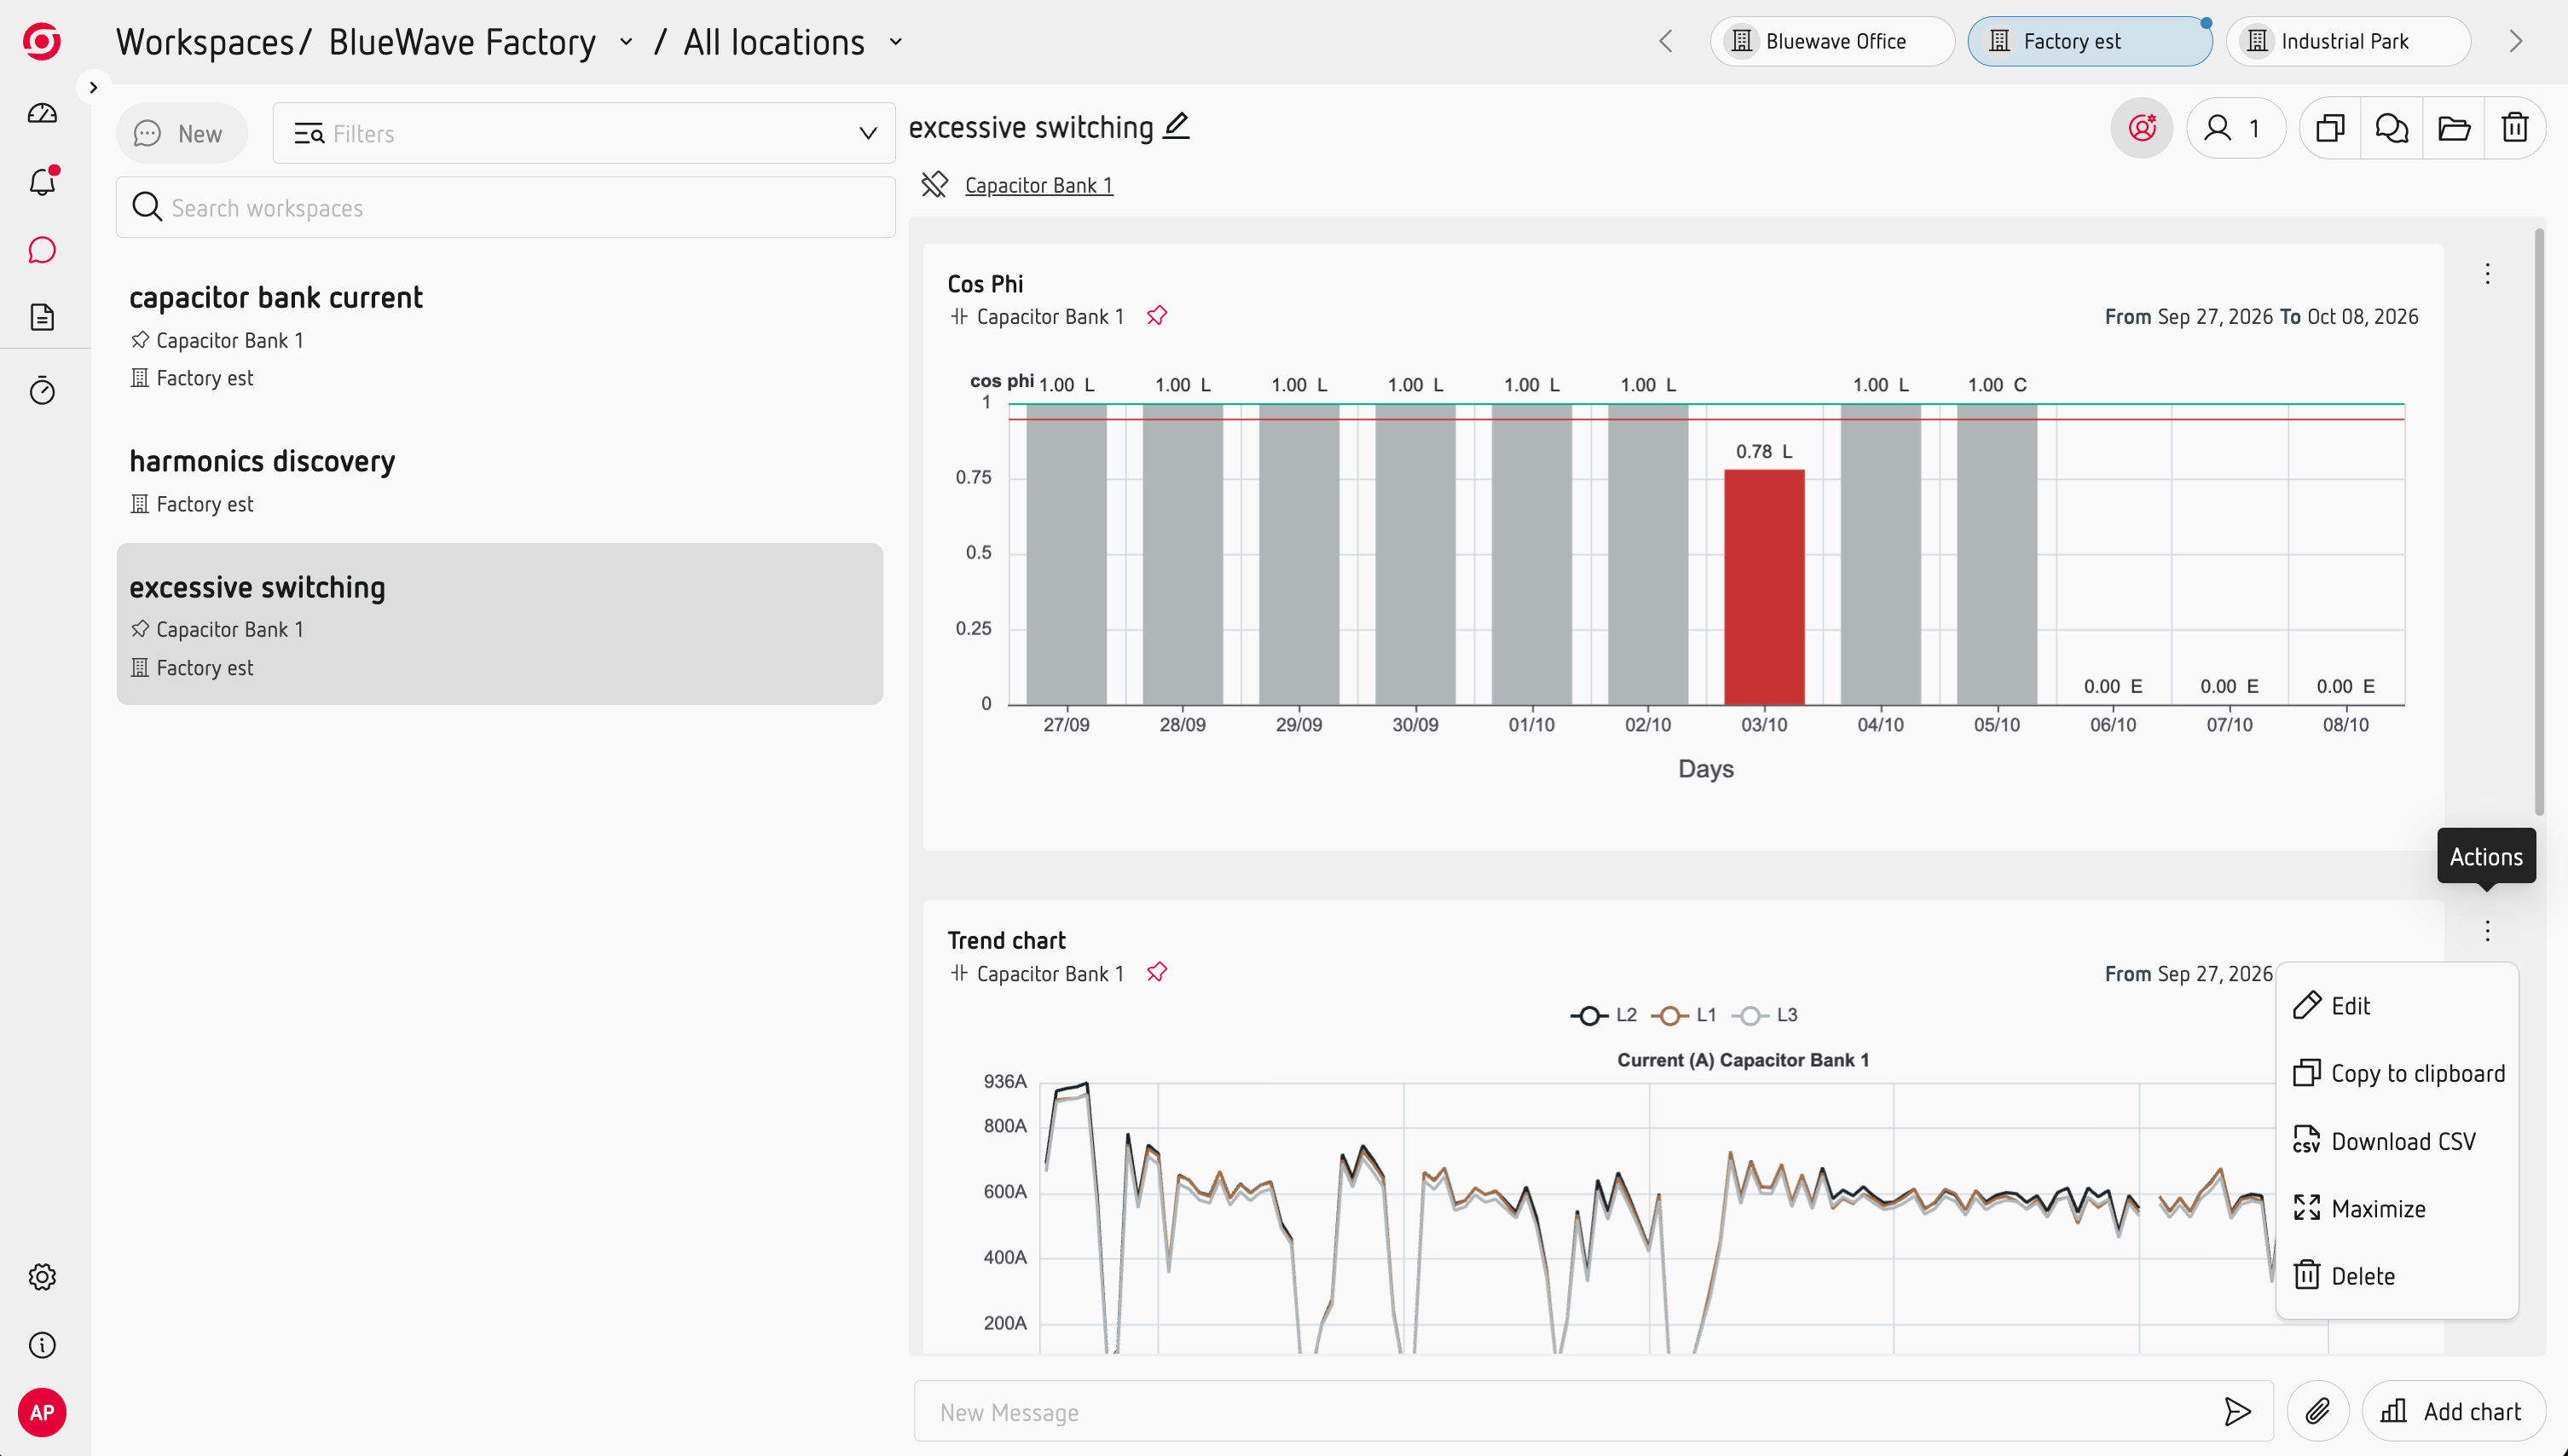
How to export data
- Open a Trend Chart.
- Select the period you want to export.
- Open the chart menu.
- Select Export to CSV.
Copy charts to your own documents
You can also copy Scout charts as images and paste them into reports, presentations or other documents.
This is particularly useful when you want to include a specific analysis or visualisation in a report without exporting the underlying data.
Choose the right option
Use CSV export when you need to work with the measurements themselves.
Use Copy as image when you want to reuse the visualisation in a document or presentation.